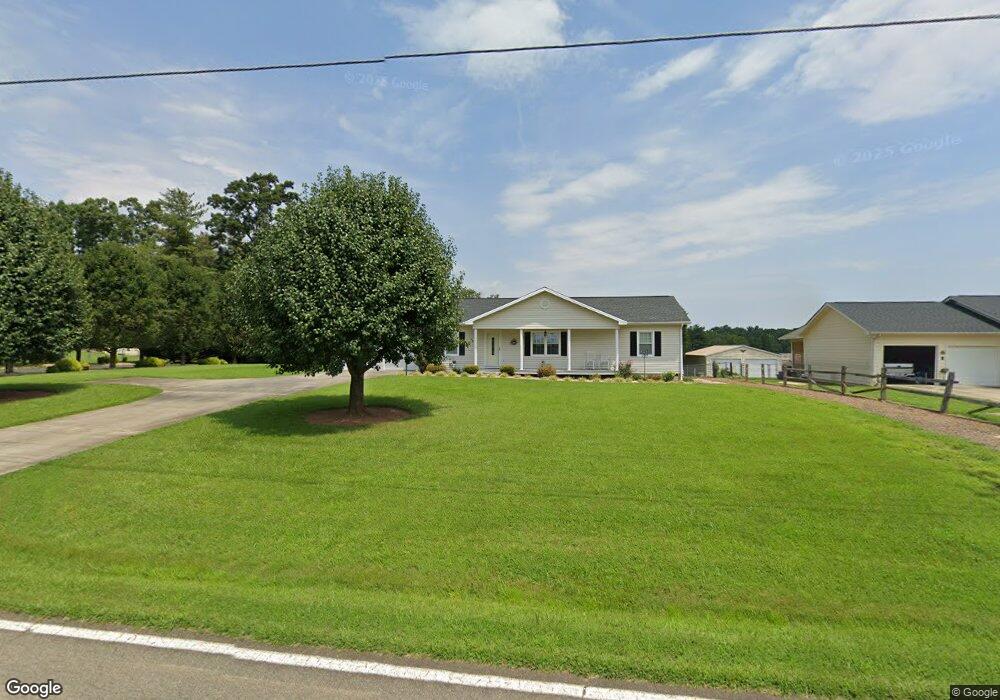
4272 Lower Cedar Valley Rd Hudson, NC 28638
Estimated Value: $242,000 - $307,000
3
Beds
2
Baths
1,488
Sq Ft
$190/Sq Ft
Est. Value
About This Home
This home is located at 4272 Lower Cedar Valley Rd, Hudson, NC 28638 and is currently estimated at $282,375, approximately $189 per square foot. 4272 Lower Cedar Valley Rd is a home located in Caldwell County with nearby schools including South Caldwell High School, Hudson Elementary School, and Hudson Middle School.
Ownership History
Date
Name
Owned For
Owner Type
Purchase Details
Closed on
Sep 6, 2023
Sold by
Craig Carolyn
Bought by
Sullivan Michael Eugene and Sullivan Robert Ervin
Current Estimated Value
Purchase Details
Closed on
Mar 23, 2023
Sold by
Craig Carolyn S
Bought by
Mclean Michael L and Mclean George G
Purchase Details
Closed on
Dec 6, 2006
Sold by
Whitis Lillie K and Whitis Ronald G
Bought by
Craig Roy Hill and Craig Carolyn Sullivan
Purchase Details
Closed on
Feb 11, 2004
Sold by
Marshall Dennis Todd
Bought by
Marshall Lillie K
Purchase Details
Closed on
May 30, 2002
Sold by
Aldridge Bradley D
Bought by
Marshall Dennis Todd
Purchase Details
Closed on
Nov 2, 2001
Sold by
Starnes Tamie Nix
Bought by
Minton David L and Minton Dana
Purchase Details
Closed on
May 4, 2000
Sold by
Cline Ernie and Cline Brenda
Bought by
Marshall Lillie Mae K
Create a Home Valuation Report for This Property
The Home Valuation Report is an in-depth analysis detailing your home's value as well as a comparison with similar homes in the area
Home Values in the Area
Average Home Value in this Area
Purchase History
| Date | Buyer | Sale Price | Title Company |
|---|---|---|---|
| Sullivan Michael Eugene | -- | None Listed On Document | |
| Mclean Michael L | $9,000 | None Listed On Document | |
| Mclean Michael L | $9,000 | None Listed On Document | |
| Craig Roy Hill | $144,000 | None Available | |
| Marshall Lillie K | $84,000 | -- | |
| Marshall Dennis Todd | $105,000 | -- | |
| Minton David L | $64,500 | -- | |
| Marshall Lillie Mae K | $80,000 | -- |
Source: Public Records
Tax History Compared to Growth
Tax History
| Year | Tax Paid | Tax Assessment Tax Assessment Total Assessment is a certain percentage of the fair market value that is determined by local assessors to be the total taxable value of land and additions on the property. | Land | Improvement |
|---|---|---|---|---|
| 2025 | $636 | $271,600 | $15,200 | $256,400 |
| 2024 | $1,249 | $154,500 | $15,200 | $139,300 |
| 2023 | $1,187 | $154,500 | $15,200 | $139,300 |
| 2022 | $593 | $154,500 | $15,200 | $139,300 |
| 2021 | $593 | $154,500 | $15,200 | $139,300 |
| 2020 | $1,026 | $133,100 | $15,200 | $117,900 |
| 2019 | $1,026 | $133,100 | $15,200 | $117,900 |
| 2018 | $511 | $133,100 | $0 | $0 |
| 2017 | $511 | $133,100 | $0 | $0 |
| 2016 | $511 | $133,100 | $0 | $0 |
| 2015 | $941 | $133,100 | $0 | $0 |
| 2014 | $941 | $133,100 | $0 | $0 |
Source: Public Records
Map
Nearby Homes
- 3167 Mitchum Dr
- 6093 Spartan Dr
- 3398 Shamrock Heights
- Thelma Ln
- 1004 Pine Mountain Rd
- 4054 Lower Cedar Valley Rd
- 2855 Wildwood St
- 3596 Gull St
- 4719 Bert Huffman Dr
- 3216 Robert Clontz Place
- 0 Pinewood Rd
- 904 Pine Mountain Rd
- 112 Meadowcreek Dr Unit 35
- 107 Cliffwood Dr
- 3 Mccall Place
- 4002 Hickory Blvd
- 1.0 Acre Highway 321 None
- 3453 Deal Mill Rd
- 128 N Main St
- 126 N Main St
- 4278 Lower Cedar Valley Rd
- 4266 Lower Cedar Valley Rd
- 4270 Lower Cedar Valley Rd
- 4279 Lower Cedar Valley Rd
- 4260 Lower Cedar Valley Rd
- 4288 Lower Cedar Valley Rd
- 4263 Lower Cedar Valley Rd
- 3266 Coble Dairy Rd
- 4285 Lower Cedar Valley Rd
- 3265 Coble Dairy Rd
- 3260 Coble Dairy Rd
- 3304 Ester Ln
- 4251 Lower Cedar Valley Rd
- 4295 Lower Cedar Valley Rd
- 3259 Coble Dairy Rd
- 4298 Lower Cedar Valley Rd
- 4340 Coble Ln
- 4334 Coble Ln
- 3252 Coble Dairy Rd
- 4330 Coble Ln