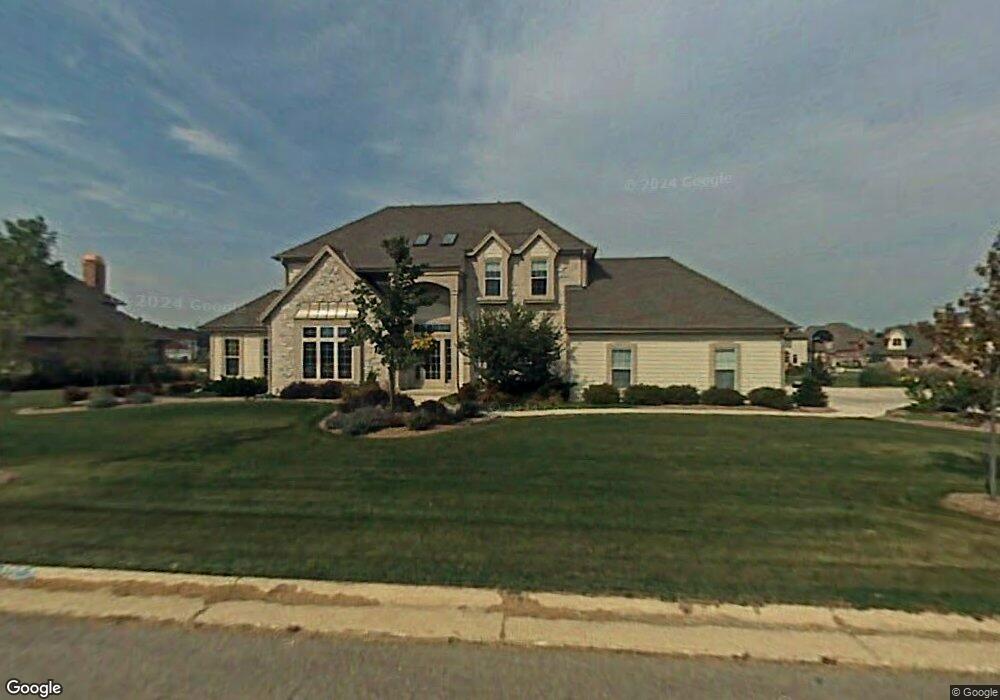
Estimated Value: $798,010 - $973,000
4
Beds
4
Baths
4,101
Sq Ft
$211/Sq Ft
Est. Value
About This Home
This home is located at 4274 95th St, Pleasant Prairie, WI 53158 and is currently estimated at $865,670, approximately $211 per square foot. 4274 95th St is a home located in Kenosha County with nearby schools including Jeffery Elementary School, Lance Middle School, and Tremper High School.
Ownership History
Date
Name
Owned For
Owner Type
Purchase Details
Closed on
Dec 4, 2018
Sold by
Kadamian Joseph L
Bought by
Ventura Rita R
Current Estimated Value
Purchase Details
Closed on
Jun 15, 2012
Sold by
Hanken Randall P and Hanken Audrey J
Bought by
Kadamian Joseph L and Kadamian Rita R
Home Financials for this Owner
Home Financials are based on the most recent Mortgage that was taken out on this home.
Original Mortgage
$354,750
Interest Rate
3.87%
Mortgage Type
New Conventional
Create a Home Valuation Report for This Property
The Home Valuation Report is an in-depth analysis detailing your home's value as well as a comparison with similar homes in the area
Home Values in the Area
Average Home Value in this Area
Purchase History
| Date | Buyer | Sale Price | Title Company |
|---|---|---|---|
| Ventura Rita R | -- | None Available | |
| Kadamian Joseph L | $473,000 | Knight Barry Title Inc |
Source: Public Records
Mortgage History
| Date | Status | Borrower | Loan Amount |
|---|---|---|---|
| Previous Owner | Kadamian Joseph L | $354,750 |
Source: Public Records
Tax History Compared to Growth
Tax History
| Year | Tax Paid | Tax Assessment Tax Assessment Total Assessment is a certain percentage of the fair market value that is determined by local assessors to be the total taxable value of land and additions on the property. | Land | Improvement |
|---|---|---|---|---|
| 2024 | $8,225 | $711,100 | $186,000 | $525,100 |
| 2023 | $8,535 | $642,200 | $165,400 | $476,800 |
| 2022 | $8,682 | $642,200 | $165,400 | $476,800 |
| 2021 | $10,070 | $538,600 | $104,700 | $433,900 |
| 2020 | $10,236 | $538,600 | $104,700 | $433,900 |
| 2019 | $9,411 | $538,600 | $104,700 | $433,900 |
| 2018 | $9,598 | $538,600 | $104,700 | $433,900 |
| 2017 | $10,257 | $475,300 | $93,700 | $381,600 |
| 2016 | $10,127 | $475,300 | $93,700 | $381,600 |
| 2015 | $9,136 | $448,400 | $77,200 | $371,200 |
| 2014 | -- | $448,400 | $77,200 | $371,200 |
Source: Public Records
Map
Nearby Homes