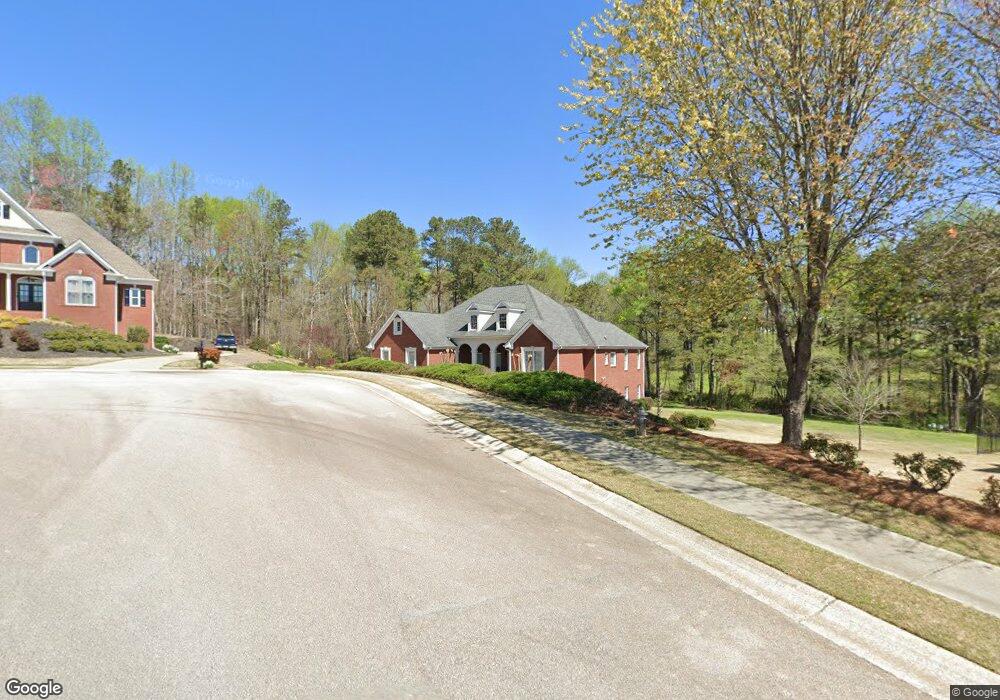
4274 Creek Valley Point Flowery Branch, GA 30542
Estimated Value: $562,658 - $702,000
3
Beds
3
Baths
2,705
Sq Ft
$235/Sq Ft
Est. Value
About This Home
This home is located at 4274 Creek Valley Point, Flowery Branch, GA 30542 and is currently estimated at $636,415, approximately $235 per square foot. 4274 Creek Valley Point is a home located in Hall County with nearby schools including Chicopee Elementary School, South Hall Middle School, and Johnson High School.
Ownership History
Date
Name
Owned For
Owner Type
Purchase Details
Closed on
Oct 20, 2020
Sold by
Jordan Penny L
Bought by
Jordan Randall C
Current Estimated Value
Purchase Details
Closed on
Aug 10, 2009
Sold by
Grae Fred J and Grae Donna M
Bought by
Jordan Randall C and Jordan Penny L
Home Financials for this Owner
Home Financials are based on the most recent Mortgage that was taken out on this home.
Original Mortgage
$248,000
Interest Rate
5.26%
Mortgage Type
New Conventional
Purchase Details
Closed on
Oct 28, 2003
Sold by
Glisson John V and Glisson Patti M
Bought by
Grae Fred J and Grae Donna
Purchase Details
Closed on
Mar 13, 2003
Sold by
Dmj Associates Llc
Bought by
Glisson John V and Glisson Patti M
Home Financials for this Owner
Home Financials are based on the most recent Mortgage that was taken out on this home.
Original Mortgage
$60,038
Interest Rate
5.88%
Mortgage Type
New Conventional
Create a Home Valuation Report for This Property
The Home Valuation Report is an in-depth analysis detailing your home's value as well as a comparison with similar homes in the area
Home Values in the Area
Average Home Value in this Area
Purchase History
| Date | Buyer | Sale Price | Title Company |
|---|---|---|---|
| Jordan Randall C | -- | -- | |
| Jordan Randall C | $310,000 | -- | |
| Grae Fred J | $59,900 | -- | |
| Glisson John V | $59,900 | -- |
Source: Public Records
Mortgage History
| Date | Status | Borrower | Loan Amount |
|---|---|---|---|
| Previous Owner | Jordan Randall C | $248,000 | |
| Previous Owner | Glisson John V | $60,038 |
Source: Public Records
Tax History Compared to Growth
Tax History
| Year | Tax Paid | Tax Assessment Tax Assessment Total Assessment is a certain percentage of the fair market value that is determined by local assessors to be the total taxable value of land and additions on the property. | Land | Improvement |
|---|---|---|---|---|
| 2024 | $1,949 | $225,760 | $21,520 | $204,240 |
| 2023 | $1,658 | $202,640 | $21,520 | $181,120 |
| 2022 | $1,586 | $166,240 | $21,520 | $144,720 |
| 2021 | $1,597 | $158,400 | $21,520 | $136,880 |
| 2020 | $1,571 | $152,200 | $21,520 | $130,680 |
| 2019 | $1,556 | $146,920 | $21,520 | $125,400 |
| 2018 | $1,525 | $140,000 | $21,520 | $118,480 |
| 2017 | $1,246 | $119,200 | $19,840 | $99,360 |
| 2016 | $3,333 | $119,200 | $19,840 | $99,360 |
| 2015 | $3,140 | $119,200 | $19,840 | $99,360 |
| 2014 | $3,140 | $131,030 | $19,840 | $111,190 |
Source: Public Records
Map
Nearby Homes
- 4434 Oxburgh Park
- 4439 Oxburgh Park
- 4315 Marble Arch Way
- 3929 Perry Ln
- 3969 Bolding Rd
- 3617 Winder Hwy
- 0 Marble Arch Way
- 4708 Upper Berkshire Rd Unit 39
- 4610 Blakeford Ct
- 4478 Longmead Rd
- 3582 Winder Hwy
- 4621 Chartwell Chase Ct
- 4838 Netherlands Place
- 4835 Upper Berkshire Rd
- 4743 Amsterdam Ln
- 3927 Celtic Ct
- 4086 Parks Rd
- 4135 Ashford Way
- 4280 Creek Valley Point
- 4268 Creek Valley Point
- 4268 Creek Valley Point Unit 22
- 4275 Creek Valley Point
- 4265 Creek Valley Point
- 4250 Creek Water Crossing
- 4298 Creek Water Crossing
- 4238 Creek Water Crossing Unit 24
- 4238 Creek Water Crossing
- 4291 Creek Water Crossing
- 4255 Creek Water Crossing
- 4249 Creek Water Crossing
- 4299 Creek Water Crossing
- 4295 Creek Water Crossing
- 3749 Winder Hwy
- 4243 Creek Water Crossing
- 4133 Falling Water Ct
- 3769 Winder Hwy
- 4220 Creek Water Crossing
- 4129 Falling Water Ct