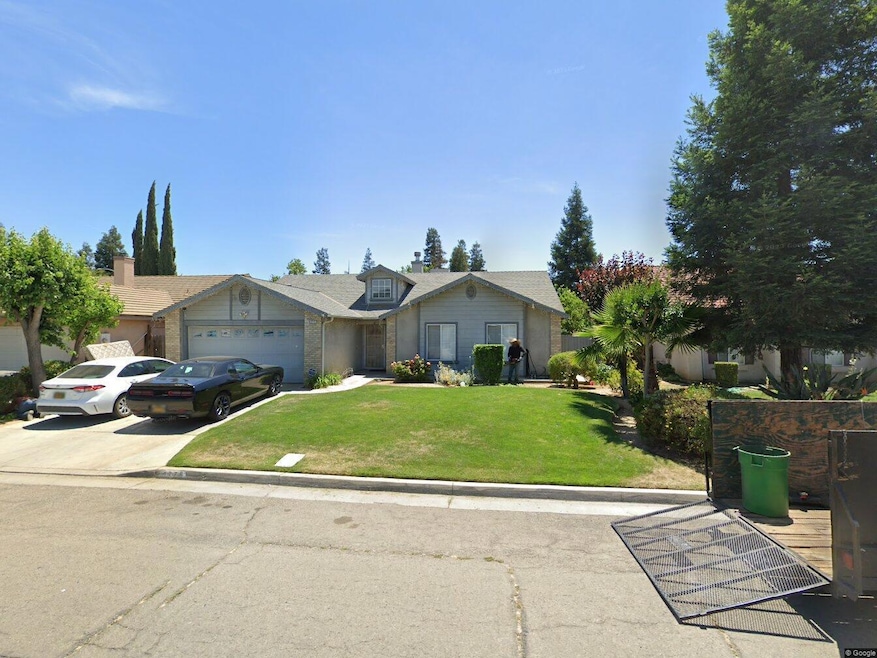
4275 W Harvard Ave Fresno, CA 93722
West Fresno NeighborhoodHighlights
- Midcentury Modern Architecture
- Covered Patio or Porch
- 1-Story Property
- 1 Fireplace
- Bathtub with Shower
- Central Heating and Cooling System
About This Home
Beautiful house 4 bedroom and 2 bath available for rent .All appliances including fridge, microwave, washer and dryer included. Big backyard with fruit trees in it .Owner pays for lawn and pest services .Renter is responsible for utilities and pgne.
Home Details
Home Type
- Single Family
Est. Annual Taxes
- $2,260
Year Built
- Built in 2002
Lot Details
- 6,200 Sq Ft Lot
- Lot Dimensions are 62x100
- Front Yard Sprinklers
- Property is zoned RS5
Home Design
- Midcentury Modern Architecture
- Concrete Foundation
- Composition Roof
- Stucco
Interior Spaces
- 1,736 Sq Ft Home
- 1-Story Property
- 1 Fireplace
- Carpet
- Laundry in unit
Kitchen
- Microwave
- Dishwasher
- Disposal
Bedrooms and Bathrooms
- 4 Bedrooms
- 2 Bathrooms
- Bathtub with Shower
Additional Features
- Covered Patio or Porch
- Central Heating and Cooling System
Map
Source: Fresno MLS
MLS Number: 639042
APN: 312-545-26
Disclaimer: Certain information contained herein is derived from information provided by parties other than Homes.com. All information provided is deemed reliable, but is not guaranteed to be accurate and should be independently verified.
![]() IDX information is provided exclusively for personal, non-commercial use, and may not be used for any purpose other than to identify prospective properties consumers may be interested in purchasing. Information is deemed reliable but not guaranteed.
IDX information is provided exclusively for personal, non-commercial use, and may not be used for any purpose other than to identify prospective properties consumers may be interested in purchasing. Information is deemed reliable but not guaranteed.
- 4189 W Providence Ave
- 2387 N Hanover Ave
- 4360 W Vassar Ave
- 2413 N Sonora Ave
- 2393 N Blythe Ave
- 4239 W Cambridge Ave
- 2260 N Hanover Ave
- 4247 W Weldon Ave
- 2457 N Milburn Ave
- 2566 N Antioch Ave
- 3043 N Brunswick Ave
- 4657 W Berkeley Ave
- 4667 W Amherst Ave
- 1714 N Blythe Ave
- 4694 W Shields Ave
- 4765 W Shields Ave
- 3125 N Milburn Ave
- 2780 N Marty Ave
- 1976 N Belvedere Ave
- 5109 W Clinton Ave
- 5304 W Ramona Ave
- 2130 N Marks Ave
- 3025 W Pontiac Way
- 4144 N Valentine Ave
- 3158 W Austin Way Unit 102
- 5462 W Holland Ave
- 4498 N Cornelia Ave
- 1715 W Clinton Ave
- 1528 W Cortland Ave
- 1331 W Yale Ave
- 4629 N Charles Ave Unit 102
- 1870 W Ashlan Ave
- 1545 W Sussex Way
- 1510 N Brooks Ave
- 1136 W Dakota Ave
- 941 W Dakota Ave
- 3515 W San Jose Ave
- 4290 W San Jose Ave
- 4313 N Emerson Ave Unit 102
- 5220 N Brawley Ave
