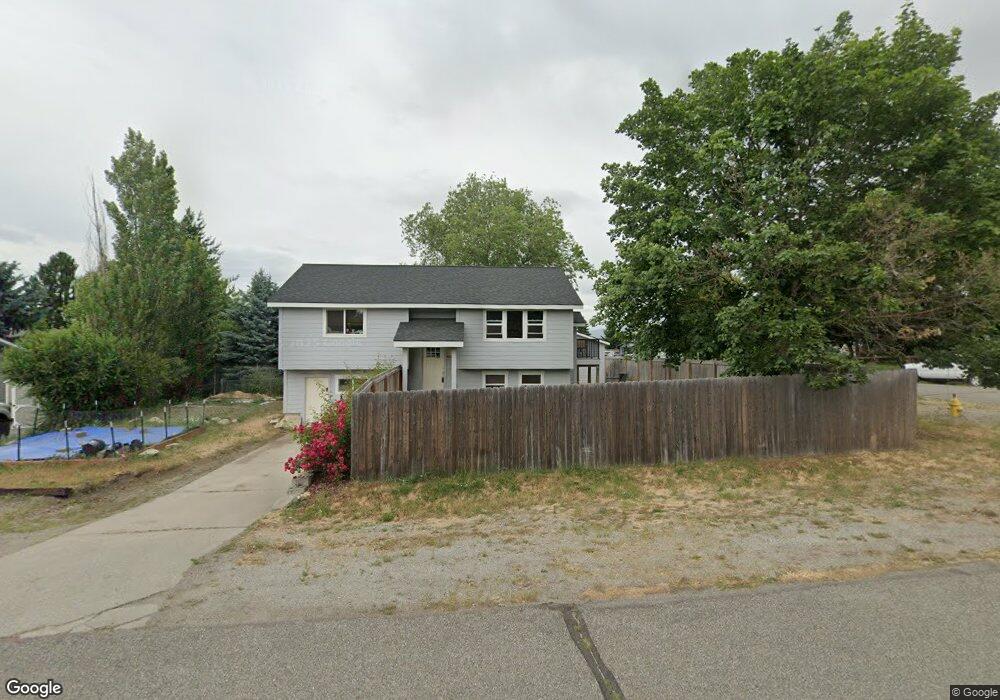
4275 W Periwinkle Ln Post Falls, ID 83854
Riverbend NeighborhoodEstimated Value: $477,000 - $521,000
3
Beds
2
Baths
1,888
Sq Ft
$263/Sq Ft
Est. Value
About This Home
This home is located at 4275 W Periwinkle Ln, Post Falls, ID 83854 and is currently estimated at $497,436, approximately $263 per square foot. 4275 W Periwinkle Ln is a home located in Kootenai County with nearby schools including Seltice Elementary School, River City Middle School, and Post Falls High School.
Ownership History
Date
Name
Owned For
Owner Type
Purchase Details
Closed on
Dec 1, 2023
Sold by
Vasseur Jami Jo
Bought by
Vasseur Jami Jo and Hayson Skyler Wayne
Current Estimated Value
Home Financials for this Owner
Home Financials are based on the most recent Mortgage that was taken out on this home.
Original Mortgage
$262,000
Outstanding Balance
$257,863
Interest Rate
7.76%
Mortgage Type
New Conventional
Estimated Equity
$239,573
Purchase Details
Closed on
Nov 15, 2023
Sold by
Vasseur Jason
Bought by
Vasseur Jami Jo
Home Financials for this Owner
Home Financials are based on the most recent Mortgage that was taken out on this home.
Original Mortgage
$262,000
Outstanding Balance
$257,863
Interest Rate
7.76%
Mortgage Type
New Conventional
Estimated Equity
$239,573
Purchase Details
Closed on
Mar 26, 2019
Sold by
Washburn Stephen
Bought by
Vasseur Jason and Vasseur Jami
Home Financials for this Owner
Home Financials are based on the most recent Mortgage that was taken out on this home.
Original Mortgage
$6,650
Interest Rate
4.3%
Mortgage Type
Stand Alone Second
Create a Home Valuation Report for This Property
The Home Valuation Report is an in-depth analysis detailing your home's value as well as a comparison with similar homes in the area
Home Values in the Area
Average Home Value in this Area
Purchase History
| Date | Buyer | Sale Price | Title Company |
|---|---|---|---|
| Vasseur Jami Jo | -- | Pioneer Title | |
| Vasseur Jami Jo | -- | Pioneer Title | |
| Vasseur Jami Jo | -- | Pioneer Title | |
| Vasseur Jason | -- | Pioneer Title Kootenai Cnty |
Source: Public Records
Mortgage History
| Date | Status | Borrower | Loan Amount |
|---|---|---|---|
| Open | Vasseur Jami Jo | $262,000 | |
| Closed | Vasseur Jami Jo | $262,000 | |
| Previous Owner | Vasseur Jason | $6,650 |
Source: Public Records
Tax History Compared to Growth
Tax History
| Year | Tax Paid | Tax Assessment Tax Assessment Total Assessment is a certain percentage of the fair market value that is determined by local assessors to be the total taxable value of land and additions on the property. | Land | Improvement |
|---|---|---|---|---|
| 2024 | $1,298 | $477,770 | $195,500 | $282,270 |
| 2023 | $1,298 | $503,175 | $195,500 | $307,675 |
| 2022 | $1,559 | $488,965 | $170,000 | $318,965 |
| 2021 | $1,468 | $331,760 | $130,000 | $201,760 |
| 2020 | $1,592 | $301,940 | $115,000 | $186,940 |
| 2019 | $1,432 | $260,730 | $85,000 | $175,730 |
| 2018 | $1,307 | $233,700 | $75,000 | $158,700 |
| 2017 | $864 | $187,920 | $75,000 | $112,920 |
| 2016 | $958 | $162,270 | $55,000 | $107,270 |
| 2015 | $1,000 | $164,290 | $50,000 | $114,290 |
| 2013 | $1,540 | $180,200 | $54,000 | $126,200 |
Source: Public Records
Map
Nearby Homes
- L1B1 W Riverbend Ave
- 609 S Windswept Trail
- 821 S Majestic View Dr
- 574 N Hydra Place Unit A
- 574 Hydra Place Unit B
- 5770 W Gumwood Cir
- 452 Creative
- 1147 N Innovation Way
- 5612 W Gumwood Cir
- 631 N Creative
- 639 N Creative
- 645 N Creative
- 653 N Creative
- 5856 W Seltice Way
- 7250 W Seltice Way
- 5138 W Gumwood Cir
- 661 N Creative
- 669 N Creative
- 677 N Creative
- 685 N Creative
- 4299 W Periwinkle Ln
- 4171 W Pleasant Ln
- 4230 W Pleasant Ln
- 4200 W Pleasant Ln
- 4107 W Pleasant Ln
- 4317 W Periwinkle Ln
- 4266 W Periwinkle Ln
- 90 W Pleasant Ln
- 4 Lochsa St
- 40 W Pleasant Ln
- 60 W Pleasant Ln
- 4270 W Pleasant Ln
- 4306 W Periwinkle Ln
- 4089 W Pleasant Ln
- 4170 W Pleasant Ln
- 4326 W Periwinkle Ln
- 4341 W Periwinkle Ln Unit 4341
- 4341 W Periwinkle Ln
- 4325 W Pleasant Ln
- 4294 W Pleasant Ln