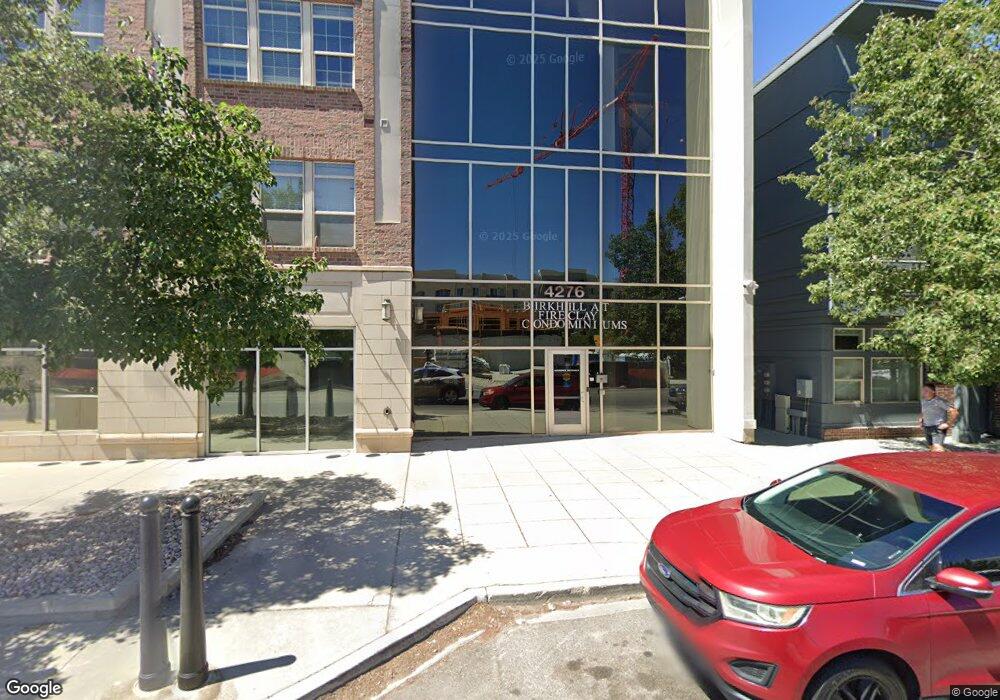
4276 S Main St Unit 403 Salt Lake City, UT 84107
Estimated Value: $313,000 - $423,000
2
Beds
2
Baths
978
Sq Ft
$350/Sq Ft
Est. Value
About This Home
This home is located at 4276 S Main St Unit 403, Salt Lake City, UT 84107 and is currently estimated at $342,037, approximately $349 per square foot. 4276 S Main St Unit 403 is a home located in Salt Lake County with nearby schools including Parkside Elementary School, Hillcrest Junior High School, and Murray High School.
Ownership History
Date
Name
Owned For
Owner Type
Purchase Details
Closed on
Jan 31, 2020
Sold by
Allomong Elie
Bought by
Allomong Elie and Allomong Timothy
Current Estimated Value
Home Financials for this Owner
Home Financials are based on the most recent Mortgage that was taken out on this home.
Original Mortgage
$204,000
Outstanding Balance
$181,106
Interest Rate
3.74%
Mortgage Type
New Conventional
Estimated Equity
$160,931
Purchase Details
Closed on
Sep 19, 2018
Sold by
Wolf Theresa and Doty Theresa
Bought by
Munyankindi Harerimana Elie
Home Financials for this Owner
Home Financials are based on the most recent Mortgage that was taken out on this home.
Original Mortgage
$213,400
Interest Rate
4.5%
Mortgage Type
New Conventional
Purchase Details
Closed on
Jun 4, 2010
Sold by
Birkhill At Fireclay Llc
Bought by
Wolf Theresa
Home Financials for this Owner
Home Financials are based on the most recent Mortgage that was taken out on this home.
Original Mortgage
$140,288
Interest Rate
5.05%
Mortgage Type
New Conventional
Create a Home Valuation Report for This Property
The Home Valuation Report is an in-depth analysis detailing your home's value as well as a comparison with similar homes in the area
Home Values in the Area
Average Home Value in this Area
Purchase History
| Date | Buyer | Sale Price | Title Company |
|---|---|---|---|
| Allomong Elie | -- | Cottonwood Title | |
| Allomong Elie | -- | Cottonwood Title | |
| Munyankindi Harerimana Elie | -- | Capstone Title & Escrow | |
| Wolf Theresa | -- | Us Title Park City |
Source: Public Records
Mortgage History
| Date | Status | Borrower | Loan Amount |
|---|---|---|---|
| Open | Allomong Elie | $204,000 | |
| Closed | Munyankindi Harerimana Elie | $213,400 | |
| Previous Owner | Wolf Theresa | $140,288 |
Source: Public Records
Tax History Compared to Growth
Tax History
| Year | Tax Paid | Tax Assessment Tax Assessment Total Assessment is a certain percentage of the fair market value that is determined by local assessors to be the total taxable value of land and additions on the property. | Land | Improvement |
|---|---|---|---|---|
| 2025 | $1,437 | $305,400 | $91,600 | $213,800 |
| 2024 | $1,437 | $312,300 | $93,700 | $218,600 |
| 2023 | $1,532 | $318,800 | $95,600 | $223,200 |
| 2022 | $1,625 | $323,800 | $97,100 | $226,700 |
| 2021 | $1,401 | $246,000 | $73,800 | $172,200 |
| 2020 | $1,342 | $222,800 | $66,800 | $156,000 |
| 2019 | $1,323 | $212,200 | $63,600 | $148,600 |
| 2018 | $1,174 | $192,000 | $57,600 | $134,400 |
| 2017 | $1,039 | $171,000 | $51,300 | $119,700 |
| 2016 | $1,073 | $170,500 | $51,100 | $119,400 |
| 2015 | $1,124 | $162,300 | $48,700 | $113,600 |
| 2014 | $1,123 | $160,700 | $48,200 | $112,500 |
Source: Public Records
Map
Nearby Homes
- 4276 S Main St Unit 213
- 4276 S Main St Unit 210
- 4186 S Main St Unit O217
- 4186 S Main St Unit O-210
- 4186 S Main St Unit N220
- 4186 S Main St Unit N221
- 4186 S Main St
- 4186 S Main St Unit O213
- 4186 S Main St Unit N223
- 4364 S Detroiter Cir
- 235 E Biltmore Ave Unit 460
- 4320 S Commerce Dr
- 296 E Nashua St Unit 112
- 313 E Vagabond Dr
- 4658 Box Elder St
- 223 E Hill Ave Unit 1
- 219 E Hill Ave Unit 6
- 223 E Hill Ave Unit 2
- 4072 S 300 E Unit 8
- 4072 S 300 E Unit 4
- 4276 S Main St Unit 414
- 4276 S Main St Unit 303
- 4276 S Main St Unit 205
- 4276 S Main St Unit 402
- 4276 S Main St Unit 401
- 4276 S Main St Unit 314
- 4276 S Main St Unit 302
- 4276 S Main St Unit 301
- 4276 S Main St Unit 411
- 4276 S Main St Unit 410
- 4276 S Main St Unit 409
- 4276 S Main St Unit 408
- 4276 S Main St Unit 407
- 4276 S Main St Unit 406
- 4276 S Main St Unit 311
- 4276 S Main St Unit 309
- 4276 S Main St Unit 307
- 4276 S Main St Unit 306
- 4276 S Main St Unit 209
- 4276 S Main St Unit 208