Estimated Value: $435,000 - $461,983
4
Beds
3
Baths
1,795
Sq Ft
$251/Sq Ft
Est. Value
About This Home
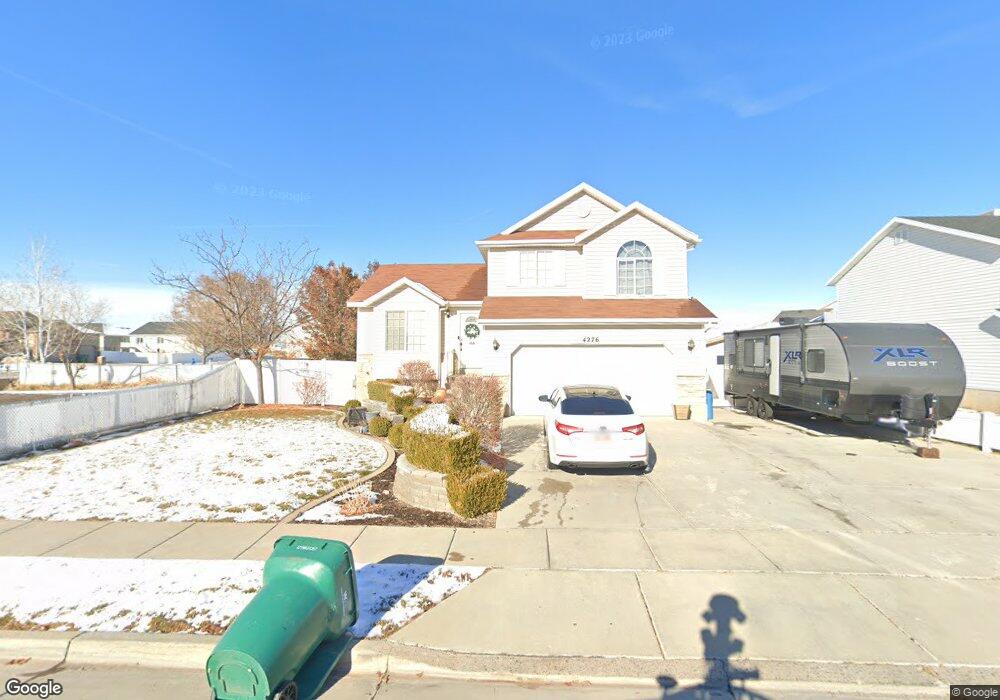
This home is located at 4276 W 5425 S, Roy, UT 84067 and is currently estimated at $450,996, approximately $251 per square foot. 4276 W 5425 S is a home located in Weber County with nearby schools including Freedom School, Roy Junior High School, and Roy High School.
Ownership History
Date
Name
Owned For
Owner Type
Purchase Details
Closed on
Feb 28, 2025
Sold by
Hopfenbeck Kim
Bought by
Nalder Dallas and Nalder Mariah
Current Estimated Value
Home Financials for this Owner
Home Financials are based on the most recent Mortgage that was taken out on this home.
Original Mortgage
$422,262
Outstanding Balance
$420,171
Interest Rate
7.04%
Mortgage Type
FHA
Estimated Equity
$30,825
Purchase Details
Closed on
Dec 6, 2018
Sold by
Smith Pamela Sue and Smith Doyle Michael
Bought by
Hopfenbeck Kim
Purchase Details
Closed on
Feb 17, 2006
Sold by
Citimortgage Inc
Bought by
Hud
Purchase Details
Closed on
Feb 1, 2006
Sold by
Zamora Robert
Bought by
Citimortgage Inc
Purchase Details
Closed on
Nov 11, 1999
Sold by
Mark Higley Construction Lc
Bought by
Gmw Development Inc
Create a Home Valuation Report for This Property
The Home Valuation Report is an in-depth analysis detailing your home's value as well as a comparison with similar homes in the area
Home Values in the Area
Average Home Value in this Area
Purchase History
| Date | Buyer | Sale Price | Title Company |
|---|---|---|---|
| Nalder Dallas | -- | None Listed On Document | |
| Hopfenbeck Kim | -- | None Available | |
| Hud | -- | None Available | |
| Citimortgage Inc | $163,892 | None Available | |
| Gmw Development Inc | -- | First American Title |
Source: Public Records
Mortgage History
| Date | Status | Borrower | Loan Amount |
|---|---|---|---|
| Open | Nalder Dallas | $422,262 |
Source: Public Records
Tax History Compared to Growth
Tax History
| Year | Tax Paid | Tax Assessment Tax Assessment Total Assessment is a certain percentage of the fair market value that is determined by local assessors to be the total taxable value of land and additions on the property. | Land | Improvement |
|---|---|---|---|---|
| 2025 | $2,770 | $441,850 | $120,013 | $321,837 |
| 2024 | $2,701 | $434,000 | $120,013 | $313,987 |
| 2023 | $2,554 | $410,000 | $119,941 | $290,059 |
| 2022 | $2,837 | $473,000 | $105,008 | $367,992 |
| 2021 | $2,161 | $323,000 | $80,017 | $242,983 |
| 2020 | $2,099 | $289,000 | $80,017 | $208,983 |
| 2019 | $2,009 | $260,000 | $45,015 | $214,985 |
| 2018 | $1,981 | $242,000 | $42,015 | $199,985 |
| 2017 | $1,879 | $215,000 | $42,015 | $172,985 |
| 2016 | $1,752 | $107,376 | $21,415 | $85,961 |
| 2015 | $1,533 | $95,389 | $21,415 | $73,974 |
| 2014 | $1,435 | $87,575 | $18,736 | $68,839 |
Source: Public Records
Map
Nearby Homes
- 4342 W 5430 S Unit B
- 4309 W 5430 St #B S
- 4337 W 5430 S Unit A
- 5270 S 4200 W
- 5539 S 4175 W
- 4449 W 5325 S
- 5465 S 4050 W
- 5116 S 4300 W
- 4218 W 5050 S
- 5644 S 4075 W
- 5235 Midland Dr
- 5013 S 4150 W
- 4021 W 5000 S
- 4990 S 4075 W
- 4890 S 4075 W
- 4141 W 4875 S
- 4700 W 5500 S
- 3832 W 5625 S
- 3766 W 5300 S
- 3923 W 5700 S