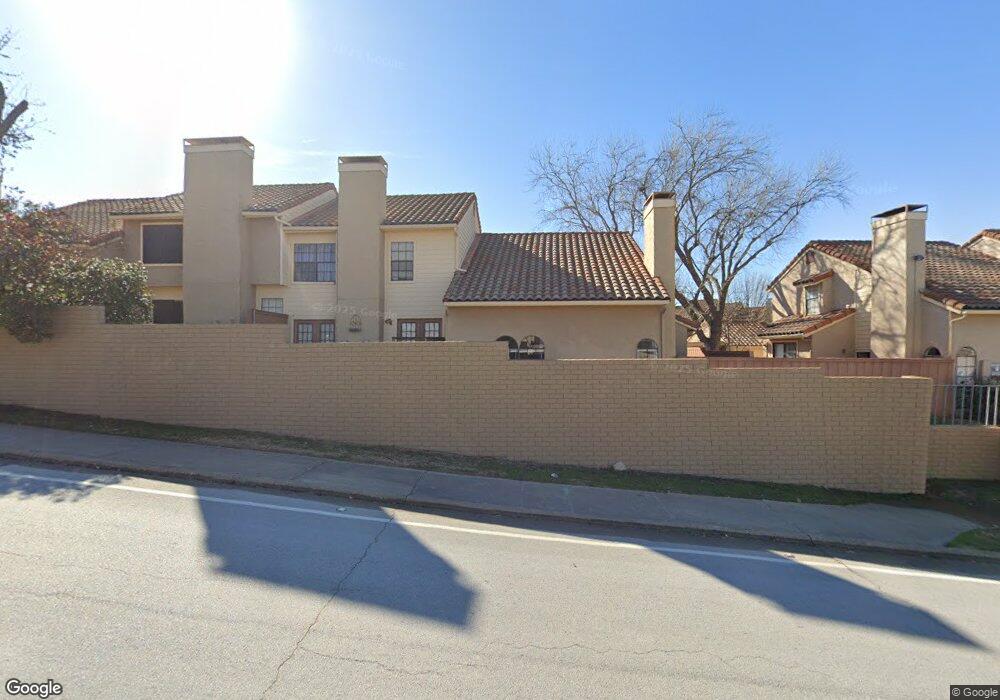
4279 Cuesta Dr Unit 1 Irving, TX 75038
Las Brisas Hills NeighborhoodEstimated Value: $261,795 - $299,000
2
Beds
3
Baths
1,461
Sq Ft
$190/Sq Ft
Est. Value
About This Home
This home is located at 4279 Cuesta Dr Unit 1, Irving, TX 75038 and is currently estimated at $277,949, approximately $190 per square foot. 4279 Cuesta Dr Unit 1 is a home located in Dallas County with nearby schools including Lee Elementary School, Sam Houston Middle School, and Macarthur High School.
Ownership History
Date
Name
Owned For
Owner Type
Purchase Details
Closed on
May 18, 2007
Sold by
Curry Robert L and Curry Mary Ann
Bought by
Hingoranee Naresh R and Hingoranee Jaya
Current Estimated Value
Home Financials for this Owner
Home Financials are based on the most recent Mortgage that was taken out on this home.
Original Mortgage
$95,655
Outstanding Balance
$56,028
Interest Rate
5.5%
Mortgage Type
Purchase Money Mortgage
Estimated Equity
$221,921
Purchase Details
Closed on
Nov 22, 1999
Sold by
Kreb Karl W and Bush Aaron A
Bought by
Curry Robert L and Curry Mary Ann
Home Financials for this Owner
Home Financials are based on the most recent Mortgage that was taken out on this home.
Original Mortgage
$95,650
Interest Rate
7.93%
Mortgage Type
VA
Purchase Details
Closed on
Dec 13, 1995
Sold by
Davenport Monte W and Davenport Kay Lynn
Bought by
Kreb Karl W
Home Financials for this Owner
Home Financials are based on the most recent Mortgage that was taken out on this home.
Original Mortgage
$76,050
Interest Rate
7.4%
Create a Home Valuation Report for This Property
The Home Valuation Report is an in-depth analysis detailing your home's value as well as a comparison with similar homes in the area
Home Values in the Area
Average Home Value in this Area
Purchase History
| Date | Buyer | Sale Price | Title Company |
|---|---|---|---|
| Hingoranee Naresh R | -- | Atc | |
| Curry Robert L | -- | -- | |
| Kreb Karl W | -- | -- |
Source: Public Records
Mortgage History
| Date | Status | Borrower | Loan Amount |
|---|---|---|---|
| Open | Hingoranee Naresh R | $95,655 | |
| Previous Owner | Curry Robert L | $95,650 | |
| Previous Owner | Kreb Karl W | $76,050 |
Source: Public Records
Tax History Compared to Growth
Tax History
| Year | Tax Paid | Tax Assessment Tax Assessment Total Assessment is a certain percentage of the fair market value that is determined by local assessors to be the total taxable value of land and additions on the property. | Land | Improvement |
|---|---|---|---|---|
| 2025 | $5,248 | $270,290 | $52,510 | $217,780 |
| 2024 | $5,248 | $270,290 | $52,510 | $217,780 |
| 2023 | $5,248 | $204,540 | $52,510 | $152,030 |
| 2022 | $4,717 | $204,540 | $52,510 | $152,030 |
| 2021 | $4,416 | $182,630 | $52,510 | $130,120 |
| 2020 | $4,582 | $182,630 | $52,510 | $130,120 |
| 2019 | $4,649 | $175,320 | $52,510 | $122,810 |
| 2018 | $1,876 | $157,790 | $0 | $0 |
| 2017 | $3,542 | $131,490 | $14,220 | $117,270 |
| 2016 | $3,031 | $112,500 | $14,220 | $98,280 |
| 2015 | $1,687 | $102,270 | $14,220 | $88,050 |
| 2014 | $1,687 | $77,930 | $14,220 | $63,710 |
Source: Public Records
Map
Nearby Homes
- 4341 Madera Rd
- 4325 Madera Rd
- 4252 Madera Rd Unit 2
- 4250 Madera Rd Unit 3
- 4269 Madera Rd Unit 2
- 4220 Madera Rd Unit 2
- 4245 Madera Rd
- 4234 Cuesta Dr
- 2344 Southcourt Cir
- 2407 Northlake Ct
- 4222 Nia Dr
- 4304 Westminster Dr
- 2639 Entrada Blvd Unit 3
- 4419 Westminster Dr
- 4421 Westminster Dr
- 4414 Westminster Dr
- 2700 Stonehaven Ct
- 2415 Skyline Dr
- 2171 Hogan Dr
- 2425 W Northgate Dr
- 4279A Cuesta Dr Unit 1
- 4279 Cuesta Dr
- 4271A Cuesta Dr Unit 3
- 4275 Cuesta Dr
- 4275 Cuesta Dr Unit 2
- 4284 Madera Rd Unit 2
- 4284 Madera Rd Unit C1
- 4275A Cuesta Dr Unit 2
- 4282 Madera Rd Unit 3
- 4273A Cuesta Dr Unit 1
- 4290 Madera Rd Unit 3
- 4290 Madera Rd Unit 3
- 4290 Madera Rd
- 4286 Madera Rd Unit 1
- 4286 Madera Rd Unit 1
- 4292 Madera Rd Unit 2
- 4292 Madera Rd Unit 2
- 4292 Madera Rd
- 4280 Madera Rd Unit 4
- 4280 Madera Rd