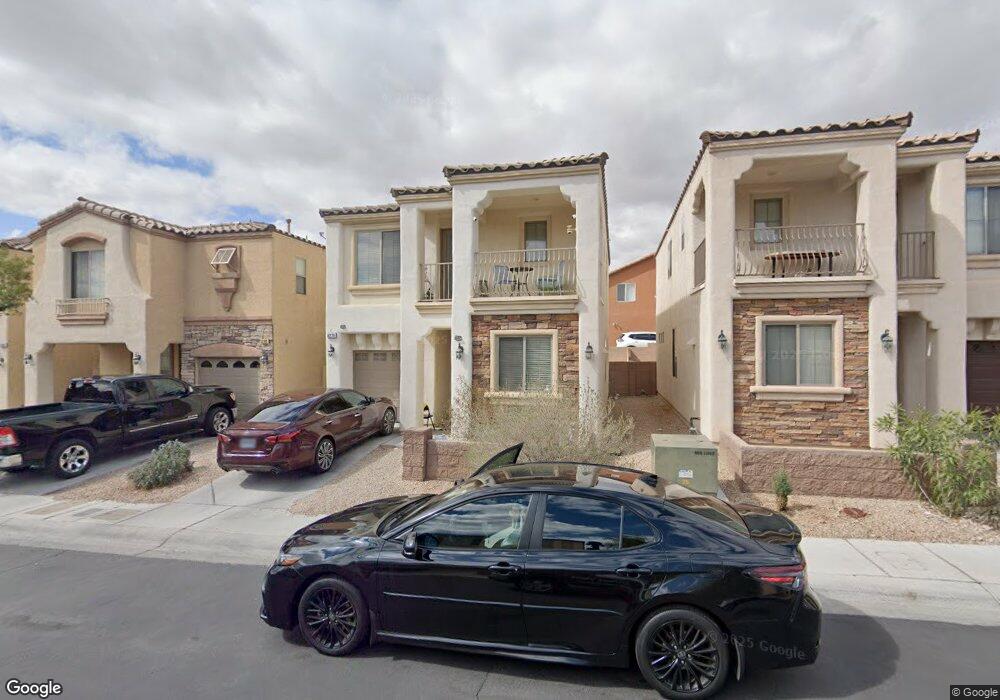
4279 Sugar Dr Las Vegas, NV 89147
Rancho Viejo NeighborhoodEstimated Value: $383,000 - $395,173
3
Beds
3
Baths
1,458
Sq Ft
$268/Sq Ft
Est. Value
About This Home
This home is located at 4279 Sugar Dr, Las Vegas, NV 89147 and is currently estimated at $390,043, approximately $267 per square foot. 4279 Sugar Dr is a home located in Clark County with nearby schools including Patricia A Bendorf Elementary School, Clifford J Lawrence Junior High School, and Spring Valley High School.
Ownership History
Date
Name
Owned For
Owner Type
Purchase Details
Closed on
Aug 6, 2008
Sold by
The Bank Of New York
Bought by
Abellana Rolando and Abellana Elvira
Current Estimated Value
Home Financials for this Owner
Home Financials are based on the most recent Mortgage that was taken out on this home.
Original Mortgage
$185,095
Outstanding Balance
$123,023
Interest Rate
6.59%
Mortgage Type
FHA
Estimated Equity
$267,020
Purchase Details
Closed on
May 16, 2008
Sold by
Carlos Anicia V
Bought by
The Bank Of New York and Certificate Holders Cwalt Inc Alternativ
Purchase Details
Closed on
Sep 13, 2007
Sold by
Carlos Anicia V
Bought by
Carlos Marcelito V
Purchase Details
Closed on
Dec 29, 2006
Sold by
Carlos Marcelo M
Bought by
Carlos Anicia V
Home Financials for this Owner
Home Financials are based on the most recent Mortgage that was taken out on this home.
Original Mortgage
$216,392
Interest Rate
6.87%
Mortgage Type
Unknown
Purchase Details
Closed on
Dec 28, 2006
Sold by
Montara Iii Llc
Bought by
Carlos Anicia V
Home Financials for this Owner
Home Financials are based on the most recent Mortgage that was taken out on this home.
Original Mortgage
$216,392
Interest Rate
6.87%
Mortgage Type
Unknown
Create a Home Valuation Report for This Property
The Home Valuation Report is an in-depth analysis detailing your home's value as well as a comparison with similar homes in the area
Home Values in the Area
Average Home Value in this Area
Purchase History
| Date | Buyer | Sale Price | Title Company |
|---|---|---|---|
| Abellana Rolando | $188,000 | First American Title Paseo V | |
| The Bank Of New York | $187,000 | Fidelity National Title | |
| Carlos Marcelito V | -- | None Available | |
| Carlos Anicia V | -- | Equity Title Of Nevada | |
| Carlos Anicia V | $270,490 | Equity Title Of Nevada |
Source: Public Records
Mortgage History
| Date | Status | Borrower | Loan Amount |
|---|---|---|---|
| Open | Abellana Rolando | $185,095 | |
| Previous Owner | Carlos Anicia V | $216,392 |
Source: Public Records
Tax History Compared to Growth
Tax History
| Year | Tax Paid | Tax Assessment Tax Assessment Total Assessment is a certain percentage of the fair market value that is determined by local assessors to be the total taxable value of land and additions on the property. | Land | Improvement |
|---|---|---|---|---|
| 2025 | $1,688 | $95,497 | $32,200 | $63,297 |
| 2024 | $1,564 | $95,497 | $32,200 | $63,297 |
| 2023 | $1,564 | $85,838 | $26,250 | $59,588 |
| 2022 | $1,448 | $80,544 | $26,250 | $54,294 |
| 2021 | $1,341 | $72,549 | $21,000 | $51,549 |
| 2020 | $1,242 | $71,314 | $20,300 | $51,014 |
| 2019 | $1,164 | $68,966 | $18,900 | $50,066 |
| 2018 | $1,111 | $61,520 | $13,650 | $47,870 |
| 2017 | $1,726 | $58,837 | $13,650 | $45,187 |
| 2016 | $1,041 | $54,129 | $10,850 | $43,279 |
| 2015 | $1,038 | $55,245 | $7,350 | $47,895 |
| 2014 | $1,008 | $33,332 | $4,550 | $28,782 |
Source: Public Records
Map
Nearby Homes
- 4274 Tarim St
- 8725 W Flamingo Rd Unit 110
- 8501 W University Ave Unit 2084
- 8501 W University Ave Unit 2053
- Kingsbury Plan at Sienna Ridge
- Bellevue NextGen Plan at Sienna Ridge
- Skyland Plan at Sienna Ridge
- Glenbrook Plan at Sienna Ridge
- Mitchell NextGen Plan at Sienna Ridge
- 8379 W Rochelle Ave
- 8373 W Rochelle Ave
- 8370 Mine Hill Ct
- 4510 Heavenly Love Way
- 4509 Heavenly Love Way
- 8756 Villa Faith Ave
- 3986 Windansea St
- 8333 W Rochelle Ave
- 8335 Caldera Hills Ave
- 8925 W Flamingo Rd Unit 201
- 8925 W Flamingo Rd Unit 111
- 4273 Sugar Dr
- 4283 Sugar Dr
- 4269 Sugar Dr
- 4289 Sugar Dr
- 4263 Sugar Dr
- 4278 Sugar Dr
- 4272 Sugar Dr
- 4282 Sugar Dr
- 4282 Sugar Dr Unit n/a
- 4270 Rimwood Ct
- 4280 Rimwood Ct Unit C
- 4280 Rimwood Ct
- 4268 Sugar Dr
- 4288 Sugar Dr
- 4259 Sugar Dr
- 4262 Sugar Dr
- 4260 Rimwood Ct
- 4260 Rimwood Ct Unit B
- 4253 S Sugar Dr
- 4253 Sugar Dr