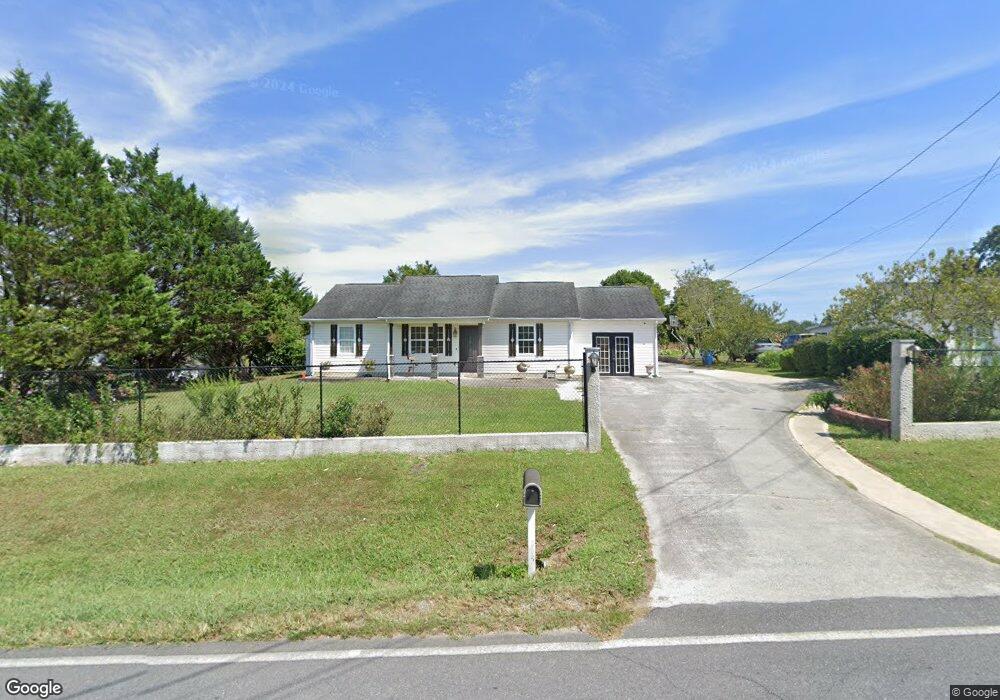
428 Campbell Rd SE Calhoun, GA 30701
Estimated Value: $240,000 - $295,000
3
Beds
2
Baths
1,673
Sq Ft
$163/Sq Ft
Est. Value
About This Home
This home is located at 428 Campbell Rd SE, Calhoun, GA 30701 and is currently estimated at $272,063, approximately $162 per square foot. 428 Campbell Rd SE is a home located in Gordon County with nearby schools including Sonoraville Elementary School, Red Bud Middle School, and Sonoraville High School.
Ownership History
Date
Name
Owned For
Owner Type
Purchase Details
Closed on
May 26, 2005
Sold by
Deark Melissa L
Bought by
Anguiano Palmerin Elizabeth and Gomez Edwin Orlando
Current Estimated Value
Home Financials for this Owner
Home Financials are based on the most recent Mortgage that was taken out on this home.
Original Mortgage
$93,679
Outstanding Balance
$48,686
Interest Rate
5.69%
Mortgage Type
FHA
Estimated Equity
$223,377
Purchase Details
Closed on
Sep 7, 1999
Bought by
Deark Scott J and Deark Melissa L
Purchase Details
Closed on
Mar 2, 1999
Bought by
Secretary Of Housing
Purchase Details
Closed on
Jun 1, 1998
Bought by
Steward William C
Purchase Details
Closed on
Aug 27, 1997
Bought by
New House Construction Co
Purchase Details
Closed on
Jul 2, 1997
Bought by
Frix Chris Flipper Mcdaniel
Purchase Details
Closed on
Mar 13, 1997
Bought by
Mcdaniel Flipper and Hoyt Whit
Create a Home Valuation Report for This Property
The Home Valuation Report is an in-depth analysis detailing your home's value as well as a comparison with similar homes in the area
Home Values in the Area
Average Home Value in this Area
Purchase History
| Date | Buyer | Sale Price | Title Company |
|---|---|---|---|
| Anguiano Palmerin Elizabeth | $95,150 | -- | |
| Deark Scott J | -- | -- | |
| Secretary Of Housing | -- | -- | |
| Steward William C | $67,300 | -- | |
| New House Construction Co | -- | -- | |
| Frix Chris Flipper Mcdaniel | -- | -- | |
| Mcdaniel Flipper | -- | -- |
Source: Public Records
Mortgage History
| Date | Status | Borrower | Loan Amount |
|---|---|---|---|
| Open | Anguiano Palmerin Elizabeth | $93,679 |
Source: Public Records
Tax History Compared to Growth
Tax History
| Year | Tax Paid | Tax Assessment Tax Assessment Total Assessment is a certain percentage of the fair market value that is determined by local assessors to be the total taxable value of land and additions on the property. | Land | Improvement |
|---|---|---|---|---|
| 2024 | $2,061 | $83,132 | $2,960 | $80,172 |
| 2023 | $1,659 | $65,288 | $2,960 | $62,328 |
| 2022 | $1,639 | $60,660 | $2,960 | $57,700 |
| 2021 | $1,294 | $46,172 | $2,680 | $43,492 |
| 2020 | $1,339 | $46,752 | $2,680 | $44,072 |
| 2019 | $1,347 | $46,752 | $2,680 | $44,072 |
| 2018 | $1,237 | $42,940 | $2,680 | $40,260 |
| 2017 | $1,198 | $40,420 | $2,680 | $37,740 |
| 2016 | $970 | $32,668 | $2,680 | $29,988 |
| 2015 | $960 | $32,028 | $2,680 | $29,348 |
| 2014 | $889 | $30,526 | $2,693 | $27,833 |
Source: Public Records
Map
Nearby Homes
- 137 Hunters Trail SE
- 3171 Dews Pond Rd SE
- 170 Willow Haven St SE
- 187 Willow Haven St SE
- 106 Valley View Cir SE
- 170 Erica Ln SE
- 279 Baker Rd SE
- 127 Alex Ct
- 130 Burnt Hickory Ln SE
- 408 Peachtree Ln SE
- 194 Cardinal Blvd SE
- 192 Cardinal Blvd SE
- 4134 Dews Pond Rd SE
- 254 Gravely Rd SE
- 166 Woodford Way SE
- 190 Woodford Way SE
- 438 Campbell Rd SE
- 107 Mccreary Rd SE
- 446 Campbell Rd SE
- 123 Mccreary Rd SE
- 448 Campbell Rd SE
- 133 Mccreary Rd SE
- 447 Campbell Rd SE
- 126 Mccreary Rd SE
- 450 Campbell Rd SE
- 153 Mccreary Rd SE
- 109 1st St
- 481 Campbell Rd SE
- 121 Rolling Acres 1st St SE
- 144 Mccreary Rd SE
- 129 Rolling Acres 1st St SE
- 458 Campbell Rd SE
- 167 Mccreary Rd SE
- 457 Campbell Rd SE
- 310 Campbell Rd SE
- 418 Campbell Rd SE