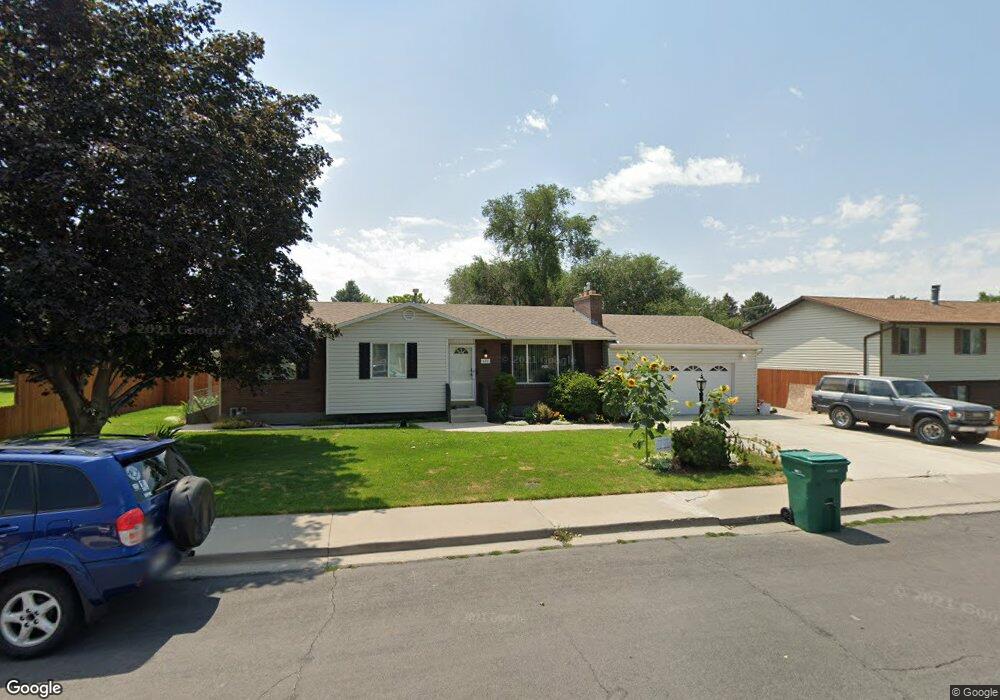
428 E 570 N Orem, UT 84097
Orchard South NeighborhoodEstimated Value: $463,000 - $510,257
3
Beds
3
Baths
1,102
Sq Ft
$447/Sq Ft
Est. Value
About This Home
This home is located at 428 E 570 N, Orem, UT 84097 and is currently estimated at $493,086, approximately $447 per square foot. 428 E 570 N is a home located in Utah County with nearby schools including Cascade Elementary School, Canyon View Junior High School, and Orem High School.
Ownership History
Date
Name
Owned For
Owner Type
Purchase Details
Closed on
Aug 9, 2016
Sold by
Craig L Pierce
Bought by
Thorsted Tyler and Thorsted Annie
Current Estimated Value
Home Financials for this Owner
Home Financials are based on the most recent Mortgage that was taken out on this home.
Original Mortgage
$205,200
Outstanding Balance
$163,461
Interest Rate
3.43%
Estimated Equity
$329,625
Purchase Details
Closed on
Nov 12, 2015
Sold by
Pierce Craig L and Pierce Naney Z
Bought by
Pierce Craig L and Pierce Nancy Z
Purchase Details
Closed on
May 26, 2015
Sold by
Pierce Craig Lynn and Pierce Nancy
Bought by
Pierce Craig L and Pierce Nancy Z
Create a Home Valuation Report for This Property
The Home Valuation Report is an in-depth analysis detailing your home's value as well as a comparison with similar homes in the area
Home Values in the Area
Average Home Value in this Area
Purchase History
| Date | Buyer | Sale Price | Title Company |
|---|---|---|---|
| Thorsted Tyler | -- | -- | |
| Pierce Craig L | -- | Affiliated First Title Co | |
| Pierce Craig L | -- | Affiliated First Title Co | |
| Pierce Craig L | -- | None Available |
Source: Public Records
Mortgage History
| Date | Status | Borrower | Loan Amount |
|---|---|---|---|
| Open | Thorsted Tyler | $205,200 | |
| Closed | Thorsted Tyler | -- |
Source: Public Records
Tax History
| Year | Tax Paid | Tax Assessment Tax Assessment Total Assessment is a certain percentage of the fair market value that is determined by local assessors to be the total taxable value of land and additions on the property. | Land | Improvement |
|---|---|---|---|---|
| 2025 | $1,902 | $249,645 | -- | -- |
| 2024 | $1,902 | $232,595 | $0 | $0 |
| 2023 | $1,761 | $231,495 | $0 | $0 |
| 2022 | $1,905 | $242,550 | $0 | $0 |
| 2021 | $1,777 | $342,700 | $138,800 | $203,900 |
| 2020 | $1,640 | $310,900 | $111,000 | $199,900 |
| 2019 | $1,436 | $283,100 | $104,100 | $179,000 |
| 2018 | $1,425 | $268,300 | $100,600 | $167,700 |
| 2017 | $1,334 | $134,585 | $0 | $0 |
| 2016 | $1,327 | $123,475 | $0 | $0 |
| 2015 | -- | $114,235 | $0 | $0 |
| 2014 | $110 | $113,850 | $0 | $0 |
Source: Public Records
Map
Nearby Homes
Your Personal Tour Guide
Ask me questions while you tour the home.