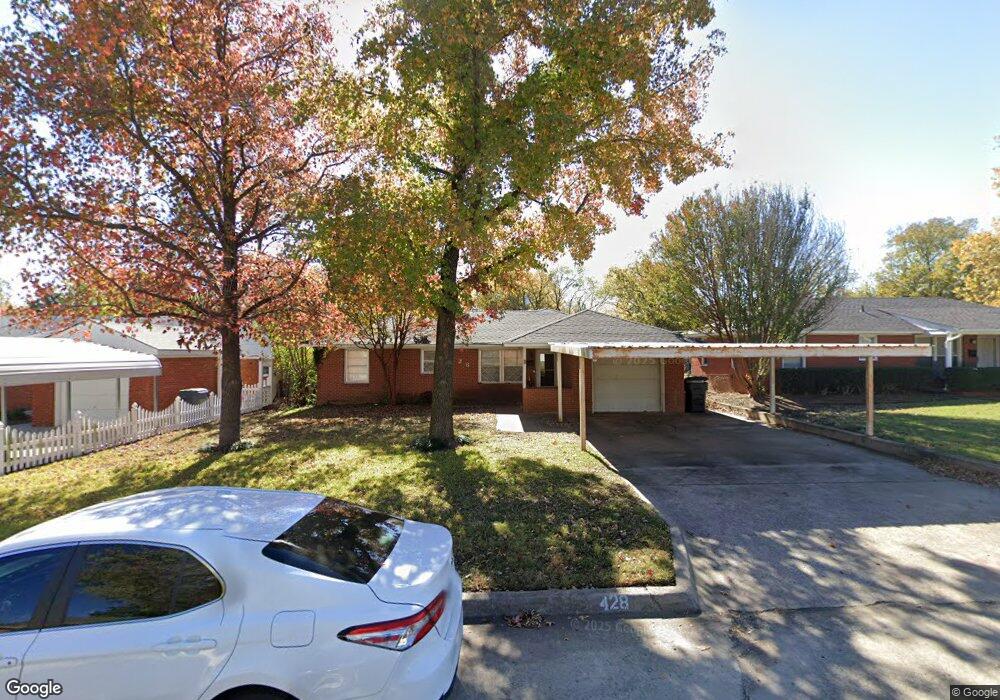
428 Locust St Ardmore, OK 73401
Estimated Value: $28,000 - $152,794
3
Beds
2
Baths
1,484
Sq Ft
$79/Sq Ft
Est. Value
About This Home
This home is located at 428 Locust St, Ardmore, OK 73401 and is currently estimated at $117,949, approximately $79 per square foot. 428 Locust St is a home located in Carter County with nearby schools including Charles Evans Elementary School, Ardmore Middle School, and Ardmore High School.
Ownership History
Date
Name
Owned For
Owner Type
Purchase Details
Closed on
Oct 11, 2024
Sold by
Lyles Julia and Lyles Christopher
Bought by
Tynes Investments Llc
Current Estimated Value
Home Financials for this Owner
Home Financials are based on the most recent Mortgage that was taken out on this home.
Original Mortgage
$139,502
Outstanding Balance
$137,760
Interest Rate
6.35%
Mortgage Type
New Conventional
Estimated Equity
-$19,811
Purchase Details
Closed on
Jun 16, 2003
Sold by
Ward Jerry D and Ward Lena B
Bought by
Choate Tommy D and Choate Helen
Purchase Details
Closed on
Sep 20, 1994
Sold by
Ward Jerry D
Bought by
Ward Jerry D
Create a Home Valuation Report for This Property
The Home Valuation Report is an in-depth analysis detailing your home's value as well as a comparison with similar homes in the area
Home Values in the Area
Average Home Value in this Area
Purchase History
| Date | Buyer | Sale Price | Title Company |
|---|---|---|---|
| Tynes Investments Llc | $26,500 | None Listed On Document | |
| Tynes Investments Llc | $26,500 | None Listed On Document | |
| Types Investment Llc | $26,500 | None Listed On Document | |
| Types Investments Llc | $26,500 | None Listed On Document | |
| Choate Tommy D | $74,500 | -- | |
| Ward Jerry D | -- | -- |
Source: Public Records
Mortgage History
| Date | Status | Borrower | Loan Amount |
|---|---|---|---|
| Open | Tynes Investments Llc | $139,502 |
Source: Public Records
Tax History Compared to Growth
Tax History
| Year | Tax Paid | Tax Assessment Tax Assessment Total Assessment is a certain percentage of the fair market value that is determined by local assessors to be the total taxable value of land and additions on the property. | Land | Improvement |
|---|---|---|---|---|
| 2025 | $1,465 | $12,720 | $1,200 | $11,520 |
| 2024 | $1,465 | $14,832 | $1,200 | $13,632 |
| 2023 | $1,489 | $15,068 | $1,200 | $13,868 |
| 2022 | $1,049 | $10,977 | $854 | $10,123 |
| 2021 | $1,055 | $10,455 | $785 | $9,670 |
| 2020 | $990 | $9,956 | $627 | $9,329 |
| 2019 | $921 | $9,483 | $598 | $8,885 |
| 2018 | $892 | $9,031 | $568 | $8,463 |
| 2017 | $786 | $8,602 | $540 | $8,062 |
| 2016 | $763 | $8,191 | $713 | $7,478 |
| 2015 | $599 | $7,802 | $361 | $7,441 |
| 2014 | $571 | $7,430 | $361 | $7,069 |
Source: Public Records
Map
Nearby Homes
- 434 Locust St NW
- 430 Locust St
- 1817 Comanche St
- 1740 Tiverton St
- 1750 Mount Washington Rd
- 703 Cottonwood St
- 1714 Salisbury St
- 505 Campbell St
- 800 Cottonwood St
- 715 Ash St
- 132 Veterans Blvd
- 11 Turner St
- 723 Maxwell St NW
- 1907 Robison St
- 722 Maxwell St NW
- 210 15th Ave NW
- 0 15th Unit 2546881
- 912 Elm St
- 00 N Rockford Rd
- 912 Maxwell St NW