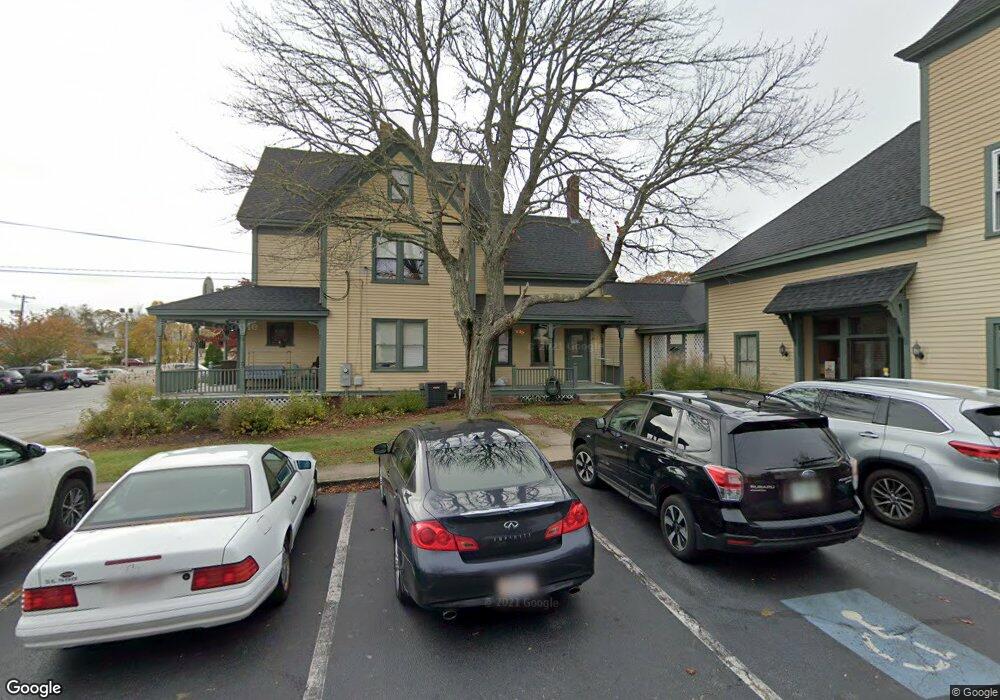
428 Main St Unit 2-7 West Dennis, MA 02670
West Dennis NeighborhoodEstimated Value: $191,000 - $354,000
2
Beds
1
Bath
747
Sq Ft
$347/Sq Ft
Est. Value
About This Home
This home is located at 428 Main St Unit 2-7, West Dennis, MA 02670 and is currently estimated at $259,442, approximately $347 per square foot. 428 Main St Unit 2-7 is a home located in Barnstable County with nearby schools including Dennis-Yarmouth Regional High School and St. Pius X. School.
Ownership History
Date
Name
Owned For
Owner Type
Purchase Details
Closed on
Feb 21, 2013
Sold by
Fhlmc
Bought by
Amy S Downey Ret
Current Estimated Value
Purchase Details
Closed on
Jul 23, 2010
Sold by
Champ Gina M
Bought by
Fhlmc
Purchase Details
Closed on
Jun 29, 2001
Sold by
French Doris R and Champ Gina M
Bought by
Cappozzi Geno C and Capozzi Shirley B
Home Financials for this Owner
Home Financials are based on the most recent Mortgage that was taken out on this home.
Original Mortgage
$89,910
Interest Rate
7.14%
Mortgage Type
Purchase Money Mortgage
Purchase Details
Closed on
Mar 14, 2001
Sold by
Santy Frank G Est
Bought by
French Doris R
Purchase Details
Closed on
May 23, 1997
Sold by
Powell Rita A
Bought by
Snowman Wayne
Home Financials for this Owner
Home Financials are based on the most recent Mortgage that was taken out on this home.
Original Mortgage
$35,000
Interest Rate
8.08%
Mortgage Type
Purchase Money Mortgage
Purchase Details
Closed on
Jan 27, 1995
Sold by
Hollis Charlotte M
Bought by
Powell Rita A
Home Financials for this Owner
Home Financials are based on the most recent Mortgage that was taken out on this home.
Original Mortgage
$23,000
Interest Rate
9.24%
Mortgage Type
Purchase Money Mortgage
Create a Home Valuation Report for This Property
The Home Valuation Report is an in-depth analysis detailing your home's value as well as a comparison with similar homes in the area
Home Values in the Area
Average Home Value in this Area
Purchase History
| Date | Buyer | Sale Price | Title Company |
|---|---|---|---|
| Amy S Downey Ret | $68,000 | -- | |
| Fhlmc | $102,032 | -- | |
| Cappozzi Geno C | $99,900 | -- | |
| French Doris R | $60,000 | -- | |
| Snowman Wayne | $50,000 | -- | |
| Powell Rita A | $46,000 | -- |
Source: Public Records
Mortgage History
| Date | Status | Borrower | Loan Amount |
|---|---|---|---|
| Previous Owner | Powell Rita A | $89,910 | |
| Previous Owner | Powell Rita A | $35,000 | |
| Previous Owner | Powell Rita A | $23,000 |
Source: Public Records
Tax History Compared to Growth
Tax History
| Year | Tax Paid | Tax Assessment Tax Assessment Total Assessment is a certain percentage of the fair market value that is determined by local assessors to be the total taxable value of land and additions on the property. | Land | Improvement |
|---|---|---|---|---|
| 2025 | $922 | $213,000 | $0 | $213,000 |
| 2024 | $874 | $199,100 | $0 | $199,100 |
| 2023 | $551 | $118,000 | $0 | $118,000 |
| 2022 | $613 | $109,400 | $0 | $109,400 |
| 2021 | $646 | $107,100 | $0 | $107,100 |
| 2020 | $634 | $104,000 | $0 | $104,000 |
| 2019 | $429 | $69,600 | $0 | $69,600 |
| 2018 | $422 | $66,500 | $0 | $66,500 |
| 2017 | $409 | $66,500 | $0 | $66,500 |
| 2016 | $415 | $63,500 | $0 | $63,500 |
| 2015 | $406 | $63,500 | $0 | $63,500 |
| 2014 | $437 | $68,800 | $0 | $68,800 |
Source: Public Records
Map
Nearby Homes
- 428 Main St Unit 1-11
- 467 Main St
- 401 Main St Unit 201
- 401 Main St Unit 101
- 23 Doric Ave
- 209 Main St Unit 3
- 209 Main St Unit 6
- 209 Main St Unit 1
- 209 Main St Unit 2
- 209 Main St Unit 4
- 209 Main St Unit 5
- 61 Trotters Ln
- 14 Schoolhouse Ln
- 178 School St
- 15 Woodside Park Rd
- 3 Pinefield Ln
- 26 Center St
- 45 Seth Ln
- 29 Bass River Rd
- 18 Turner Ln
- 428 Main St
- 428 Main St Unit 1-9
- 428 Main St Unit 2-11
- 428 Main St Unit 2-10
- 428 Main St Unit 2-9
- 428 Main St Unit 2-6
- 428 Main St Unit 2-5
- 428 Main St Unit 2-4
- 428 Main St Unit 2-3
- 428 Main St Unit 2
- 428 Main St Unit 2-1
- 428 Main St Unit 1-10
- 428 Main St Unit 1-9
- 428 Main St Unit 1-8
- 428 Main St Unit 1-6
- 428 Main St Unit 1-5
- 428 Main St Unit 1-4
- 428 Main St Unit 1-3
- 428 Main St Unit 1-2
- 428 Main St Unit 1