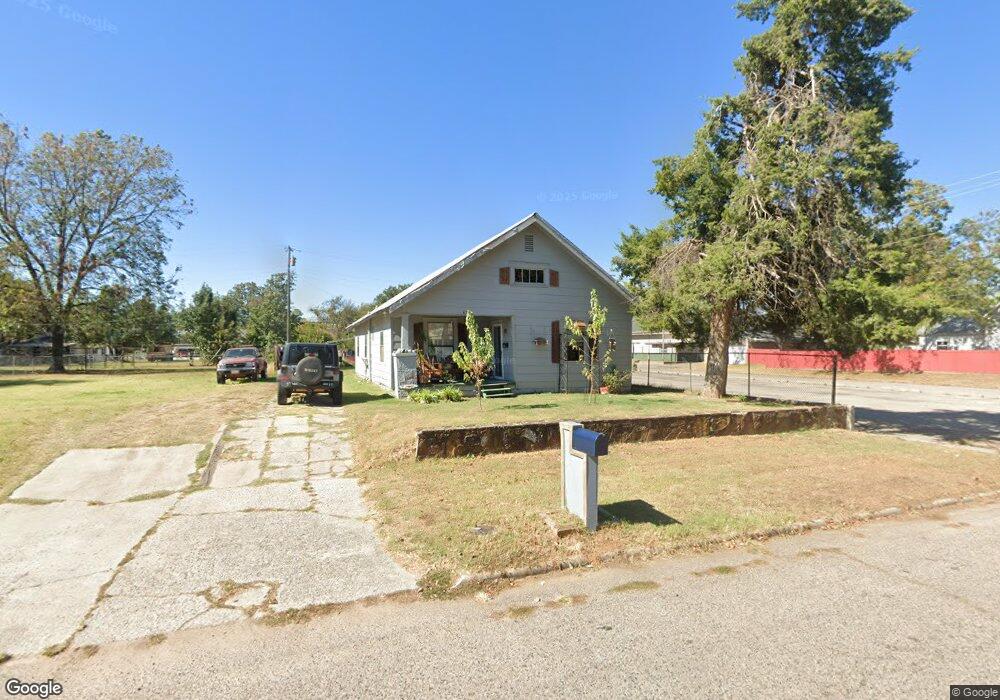
428 N Chapman Ave Shawnee, OK 74801
Estimated Value: $65,000 - $135,000
3
Beds
1
Bath
1,524
Sq Ft
$60/Sq Ft
Est. Value
About This Home
This home is located at 428 N Chapman Ave, Shawnee, OK 74801 and is currently estimated at $91,938, approximately $60 per square foot. 428 N Chapman Ave is a home located in Pottawatomie County with nearby schools including Jefferson Elementary School, Shawnee Middle School, and Shawnee High School.
Ownership History
Date
Name
Owned For
Owner Type
Purchase Details
Closed on
Feb 13, 2017
Sold by
Lrg Properties Llc
Bought by
Simms Robin
Current Estimated Value
Purchase Details
Closed on
Feb 6, 2017
Sold by
Abass Kathleen
Bought by
Lrg Properties Llc
Purchase Details
Closed on
Oct 3, 2016
Sold by
Ritter Laura and Trace Cheryl
Bought by
Abass Kathleen and Estate Of Lerlene Hill
Purchase Details
Closed on
Aug 3, 2007
Sold by
Hill Lerlene and Abass Kathleen
Bought by
Ritter Laura and Tract Cheryl
Home Financials for this Owner
Home Financials are based on the most recent Mortgage that was taken out on this home.
Original Mortgage
$67,500
Interest Rate
5.86%
Mortgage Type
Seller Take Back
Purchase Details
Closed on
Apr 2, 2002
Sold by
Conseco Finan Corp
Bought by
Hill Archie and Hill Lerlene
Purchase Details
Closed on
Sep 29, 1999
Sold by
Mays Ralph and Mays Lorece
Bought by
Klause Eric and Klause Stacy
Create a Home Valuation Report for This Property
The Home Valuation Report is an in-depth analysis detailing your home's value as well as a comparison with similar homes in the area
Home Values in the Area
Average Home Value in this Area
Purchase History
| Date | Buyer | Sale Price | Title Company |
|---|---|---|---|
| Simms Robin | $10,000 | Chicago Title Insurance | |
| Lrg Properties Llc | $6,000 | None Available | |
| Abass Kathleen | $67,500 | None Available | |
| Ritter Laura | $69,000 | None Available | |
| Hill Archie | $20,000 | -- | |
| Klause Eric | $33,000 | -- |
Source: Public Records
Mortgage History
| Date | Status | Borrower | Loan Amount |
|---|---|---|---|
| Previous Owner | Ritter Laura | $67,500 |
Source: Public Records
Tax History Compared to Growth
Tax History
| Year | Tax Paid | Tax Assessment Tax Assessment Total Assessment is a certain percentage of the fair market value that is determined by local assessors to be the total taxable value of land and additions on the property. | Land | Improvement |
|---|---|---|---|---|
| 2024 | $390 | $3,731 | $768 | $2,963 |
| 2023 | $390 | $3,731 | $768 | $2,963 |
| 2022 | $383 | $3,731 | $768 | $2,963 |
| 2021 | $376 | $3,731 | $768 | $2,963 |
| 2020 | $375 | $3,711 | $768 | $2,943 |
| 2019 | $387 | $3,711 | $768 | $2,943 |
| 2018 | $375 | $3,662 | $768 | $2,894 |
| 2017 | $418 | $4,140 | $480 | $3,660 |
| 2016 | $300 | $3,943 | $480 | $3,463 |
| 2015 | $283 | $3,828 | $480 | $3,348 |
| 2014 | $320 | $4,201 | $378 | $3,823 |
Source: Public Records
Map
Nearby Homes
- 820 W Highland St
- 618 W Highland St
- 318 N Aydelotte Ave
- 517 N Ione Ave
- 611 N Chapman Ave
- 548 N Kickapoo Ave
- 548 N Ione Ave
- 607 W Dewey St
- 634 N Louisa Ave
- 615 N Park Ave
- 1108 W Dewey St
- 426 N Beard Ave
- 321 S Aydelotte Ave
- 128 W Ridgewood St
- 718 N Park Ave
- 810 N Kickapoo Ave
- 300 S Kennedy Ave
- 735 N Park Ave
- 323 S Park Ave
- 318 W Dill St
- 410 N Chapman Ave
- 418 N Chapman Ave
- 402 N Chapman Ave
- 420 N Chapman Ave
- 424 N Chapman Ave
- 401 N Chapman Ave
- 409 N Chapman Ave
- 411 N Chapman Ave
- 405 N Chapman Ave
- 411 N Pottenger Ave
- 407 N Pottenger Ave
- 419 N Chapman Ave
- 417 N Pottenger Ave
- 403 N Pottenger Ave
- 715 W 11th St
- 419 N Pottenger Ave
- 429 N Chapman Ave
- 421 N Pottenger Ave
- 326 N Chapman Ave
- 431 N Chapman Ave