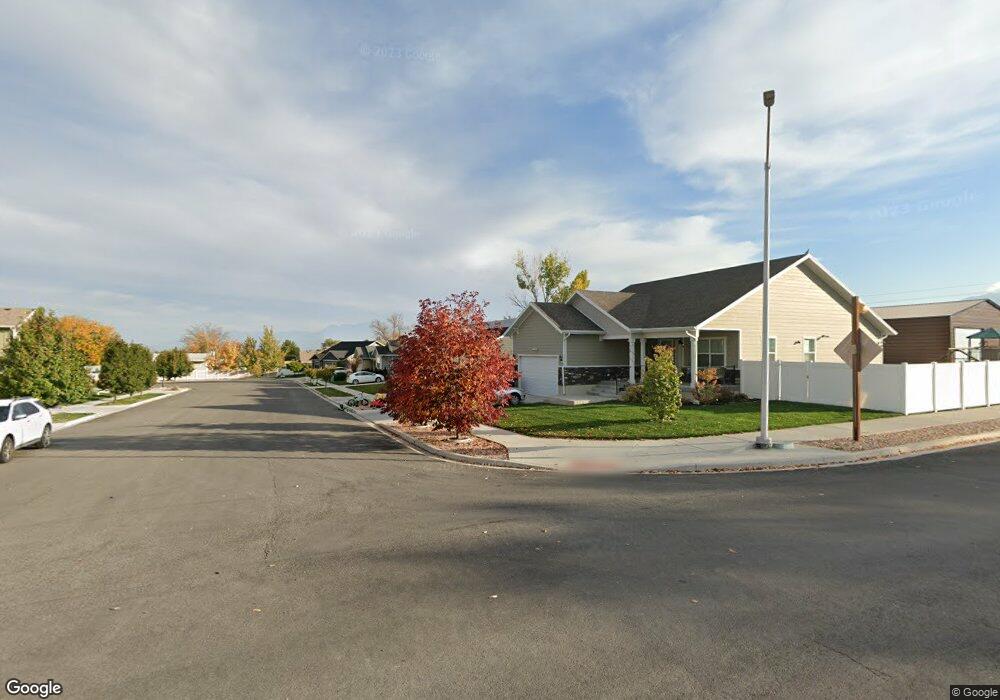
428 N Cowan Cir Payson, UT 84651
Estimated Value: $461,895 - $503,000
3
Beds
2
Baths
1,301
Sq Ft
$377/Sq Ft
Est. Value
About This Home
This home is located at 428 N Cowan Cir, Payson, UT 84651 and is currently estimated at $489,974, approximately $376 per square foot. 428 N Cowan Cir is a home with nearby schools including Barnett Elementary School, Mt. Nebo Junior High School, and Salem Junior High School.
Ownership History
Date
Name
Owned For
Owner Type
Purchase Details
Closed on
Jan 9, 2024
Sold by
Johnson John R
Bought by
John Ross Johnson And Susan Ruth Johnson Fami and Johnson
Current Estimated Value
Purchase Details
Closed on
Sep 2, 2016
Sold by
Rural Housing Development Corporation
Bought by
Johnson John R
Home Financials for this Owner
Home Financials are based on the most recent Mortgage that was taken out on this home.
Original Mortgage
$210,965
Interest Rate
3.45%
Mortgage Type
USDA
Create a Home Valuation Report for This Property
The Home Valuation Report is an in-depth analysis detailing your home's value as well as a comparison with similar homes in the area
Home Values in the Area
Average Home Value in this Area
Purchase History
| Date | Buyer | Sale Price | Title Company |
|---|---|---|---|
| John Ross Johnson And Susan Ruth Johnson Fami | -- | None Listed On Document | |
| Johnson John R | -- | Backman Title Services Ltd |
Source: Public Records
Mortgage History
| Date | Status | Borrower | Loan Amount |
|---|---|---|---|
| Previous Owner | Johnson John R | $210,965 |
Source: Public Records
Tax History Compared to Growth
Tax History
| Year | Tax Paid | Tax Assessment Tax Assessment Total Assessment is a certain percentage of the fair market value that is determined by local assessors to be the total taxable value of land and additions on the property. | Land | Improvement |
|---|---|---|---|---|
| 2025 | $2,207 | $238,975 | $116,900 | $317,600 |
| 2024 | $2,207 | $224,565 | $0 | $0 |
| 2023 | $2,230 | $227,535 | $0 | $0 |
| 2022 | $2,152 | $215,985 | $0 | $0 |
| 2021 | $1,827 | $294,200 | $86,000 | $208,200 |
| 2020 | $1,734 | $273,100 | $78,200 | $194,900 |
| 2019 | $1,517 | $245,000 | $70,000 | $175,000 |
| 2018 | $1,448 | $225,300 | $62,500 | $162,800 |
| 2017 | $806 | $53,000 | $0 | $0 |
Source: Public Records
Map
Nearby Homes