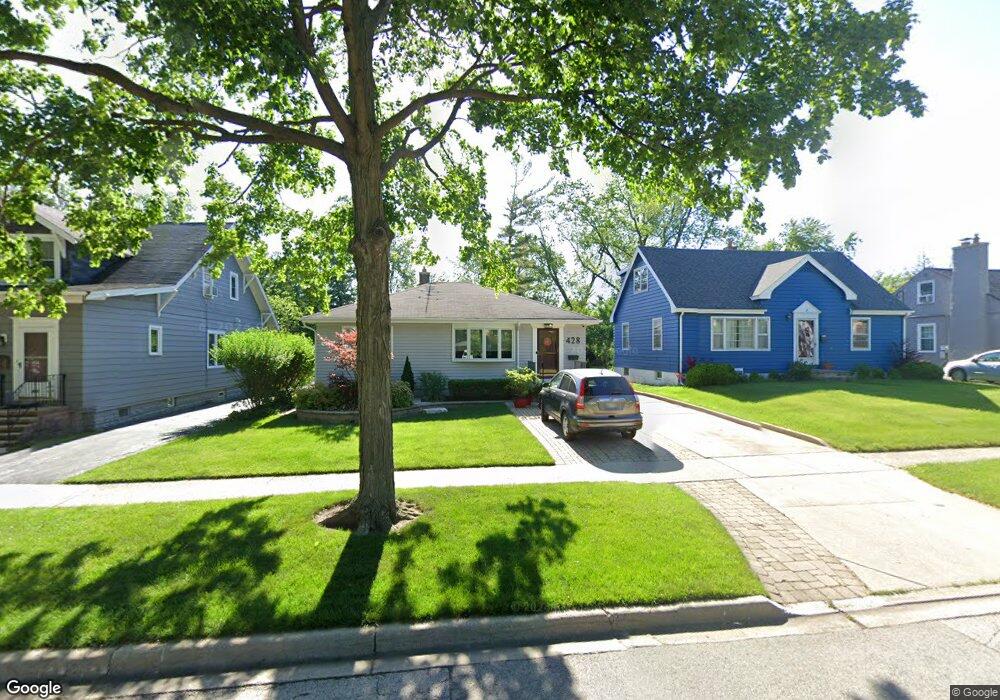
428 N Elm Ave Elmhurst, IL 60126
Estimated Value: $417,000 - $597,000
--
Bed
--
Bath
1,128
Sq Ft
$418/Sq Ft
Est. Value
About This Home
This home is located at 428 N Elm Ave, Elmhurst, IL 60126 and is currently estimated at $471,135, approximately $417 per square foot. 428 N Elm Ave is a home located in DuPage County with nearby schools including Emerson Elementary School, Churchville Middle School, and York Community High School.
Ownership History
Date
Name
Owned For
Owner Type
Purchase Details
Closed on
Sep 3, 2024
Sold by
Chiera Karen M
Bought by
James-Chiera Family Trust and Chiera
Current Estimated Value
Purchase Details
Closed on
Jun 17, 2003
Sold by
Angelilli Karen and Chiera Karen M
Bought by
Chiera Karen M
Purchase Details
Closed on
Dec 30, 1995
Sold by
Devoid Edward G and Devoid Jody M
Bought by
Angelilli Karen
Home Financials for this Owner
Home Financials are based on the most recent Mortgage that was taken out on this home.
Original Mortgage
$122,500
Interest Rate
7.11%
Purchase Details
Closed on
Mar 20, 1995
Sold by
Bogda Richard C and Bogda Joan W
Bought by
Devoid Edward G and Devoid Jody Hanley
Home Financials for this Owner
Home Financials are based on the most recent Mortgage that was taken out on this home.
Original Mortgage
$130,500
Interest Rate
8.79%
Create a Home Valuation Report for This Property
The Home Valuation Report is an in-depth analysis detailing your home's value as well as a comparison with similar homes in the area
Home Values in the Area
Average Home Value in this Area
Purchase History
| Date | Buyer | Sale Price | Title Company |
|---|---|---|---|
| James-Chiera Family Trust | -- | None Listed On Document | |
| Chiera Karen M | -- | -- | |
| Angelilli Karen | $147,500 | Intercounty Title | |
| Devoid Edward G | $145,000 | Attorneys Title Guaranty Fun |
Source: Public Records
Mortgage History
| Date | Status | Borrower | Loan Amount |
|---|---|---|---|
| Previous Owner | Angelilli Karen | $122,500 | |
| Previous Owner | Devoid Edward G | $130,500 |
Source: Public Records
Tax History Compared to Growth
Tax History
| Year | Tax Paid | Tax Assessment Tax Assessment Total Assessment is a certain percentage of the fair market value that is determined by local assessors to be the total taxable value of land and additions on the property. | Land | Improvement |
|---|---|---|---|---|
| 2024 | $7,322 | $127,556 | $70,816 | $56,740 |
| 2023 | $6,743 | $117,260 | $65,100 | $52,160 |
| 2022 | $6,501 | $112,120 | $62,300 | $49,820 |
| 2021 | $6,219 | $107,390 | $59,670 | $47,720 |
| 2020 | $5,847 | $102,860 | $57,150 | $45,710 |
| 2019 | $5,784 | $98,900 | $54,950 | $43,950 |
| 2018 | $5,408 | $92,350 | $52,340 | $40,010 |
| 2017 | $5,298 | $88,260 | $50,020 | $38,240 |
| 2016 | $5,067 | $81,490 | $46,180 | $35,310 |
| 2015 | $4,958 | $75,280 | $42,660 | $32,620 |
| 2014 | $4,369 | $62,110 | $35,200 | $26,910 |
| 2013 | $4,354 | $63,380 | $35,920 | $27,460 |
Source: Public Records
Map
Nearby Homes
- 456 N Elm Ave
- 251 W Armitage Ave
- 314 N Elm Ave
- 442 N Oak St
- 262 N Addison Ave
- 260 N Addison Ave
- 412 N Ridgeland Ave
- 258 N Addison Ave
- 254 N Addison Ave
- 322 N Highland Ave
- 468 N Highland Ave
- 407 W North Ave
- 284 N Highland Ave
- 193 N Elm Ave
- 285 N Ridgeland Ave
- 366 N Highview Ave
- 183 E Grantley Ave
- 195 N Addison Ave Unit PH03
- 196 N Walnut St
- 634 N Kenilworth Ave
- 420 N Elm Ave
- 430 N Elm Ave
- 434 N Elm Ave
- 416 N Elm Ave
- 438 N Elm Ave
- 427 N Elm Ave
- 431 N Elm Ave
- 437 N Elm Ave
- 419 N Elm Ave
- 446 N Elm Ave
- 441 N Elm Ave
- 404 N Elm Ave
- 421 N Elm Ave
- 427 N Evergreen Ave
- 423 N Evergreen Ave
- 431 N Evergreen Ave
- 243 W Fremont Ave
- 417 N Evergreen Ave
- 241 W Fremont Ave
- 448 N Elm Ave