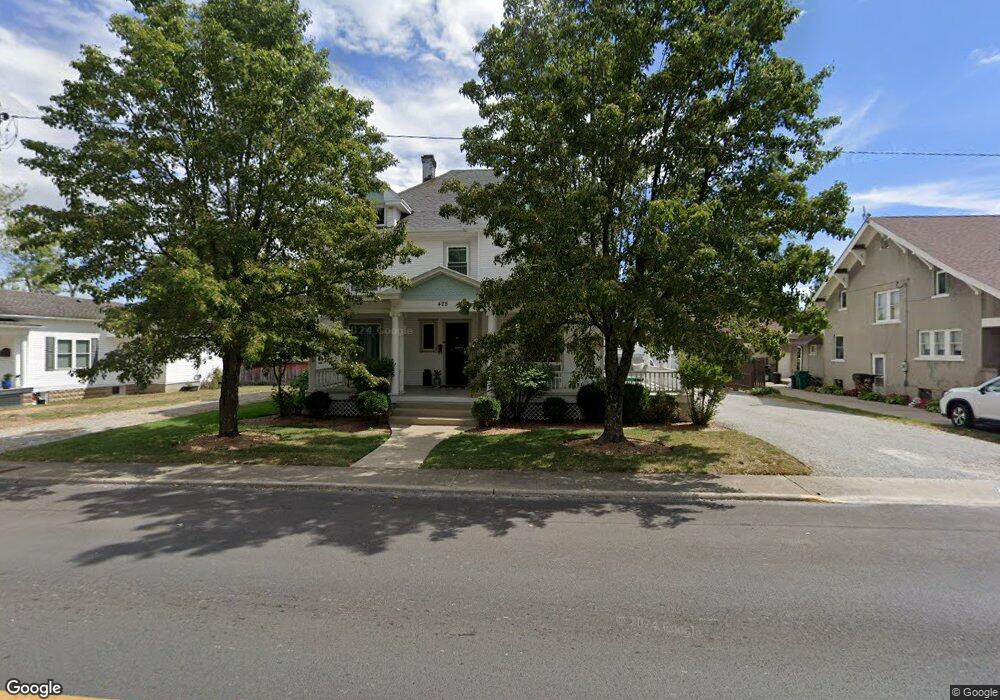
428 N Main St Georgetown, OH 45121
Estimated Value: $242,000 - $341,000
5
Beds
4
Baths
3,000
Sq Ft
$96/Sq Ft
Est. Value
About This Home
This home is located at 428 N Main St, Georgetown, OH 45121 and is currently estimated at $287,461, approximately $95 per square foot. 428 N Main St is a home located in Brown County with nearby schools including Georgetown Elementary School and Georgetown Jr/Sr High School.
Ownership History
Date
Name
Owned For
Owner Type
Purchase Details
Closed on
Aug 9, 2024
Sold by
Cooper Jerry H
Bought by
Cooper Tasha N
Current Estimated Value
Purchase Details
Closed on
Jun 25, 2007
Sold by
Hale Harley and Hale Anne
Bought by
Cooper Jerry H and Cooper Tasha N
Home Financials for this Owner
Home Financials are based on the most recent Mortgage that was taken out on this home.
Original Mortgage
$147,000
Interest Rate
6.76%
Purchase Details
Closed on
Oct 31, 1996
Sold by
Watson Carol
Bought by
Hale Harley
Create a Home Valuation Report for This Property
The Home Valuation Report is an in-depth analysis detailing your home's value as well as a comparison with similar homes in the area
Home Values in the Area
Average Home Value in this Area
Purchase History
| Date | Buyer | Sale Price | Title Company |
|---|---|---|---|
| Cooper Tasha N | $12,500 | None Listed On Document | |
| Cooper Jerry H | $147,000 | Attorney | |
| Hale Harley | $80,000 | -- |
Source: Public Records
Mortgage History
| Date | Status | Borrower | Loan Amount |
|---|---|---|---|
| Previous Owner | Cooper Jerry H | $147,000 |
Source: Public Records
Tax History Compared to Growth
Tax History
| Year | Tax Paid | Tax Assessment Tax Assessment Total Assessment is a certain percentage of the fair market value that is determined by local assessors to be the total taxable value of land and additions on the property. | Land | Improvement |
|---|---|---|---|---|
| 2024 | $2,752 | $75,880 | $7,750 | $68,130 |
| 2023 | $2,752 | $57,680 | $6,440 | $51,240 |
| 2022 | $2,274 | $57,680 | $6,440 | $51,240 |
| 2021 | $2,254 | $57,680 | $6,440 | $51,240 |
| 2020 | $1,991 | $48,040 | $5,340 | $42,700 |
| 2019 | $1,978 | $48,040 | $5,340 | $42,700 |
| 2018 | $1,965 | $48,040 | $5,340 | $42,700 |
| 2017 | $1,491 | $43,010 | $5,880 | $37,130 |
| 2016 | $1,490 | $43,010 | $5,880 | $37,130 |
| 2015 | $1,553 | $43,010 | $5,880 | $37,130 |
| 2014 | $1,553 | $42,470 | $5,340 | $37,130 |
| 2013 | $1,549 | $42,470 | $5,340 | $37,130 |
Source: Public Records
Map
Nearby Homes
- 405 N Main St
- 508 Mount Orab Pike
- 403 Elmwood Ct
- 401 Elmwood Ct
- 406 E North St
- 102 Bill Dee Dr
- 104 Elm St
- 60 New St
- 331 Spring Grove Dr
- 306 W 2nd St
- 402 S Pleasant St
- 505 S Water St
- 427 Kenwood Ave
- 874 Mount Orab Pike
- 418 Home St
- 666 E State St
- 708 E State St
- 0 St Rt 221 & Footbridge Unit 1826509
- 25 Douglas Ln
- 155 Free Soil Rd