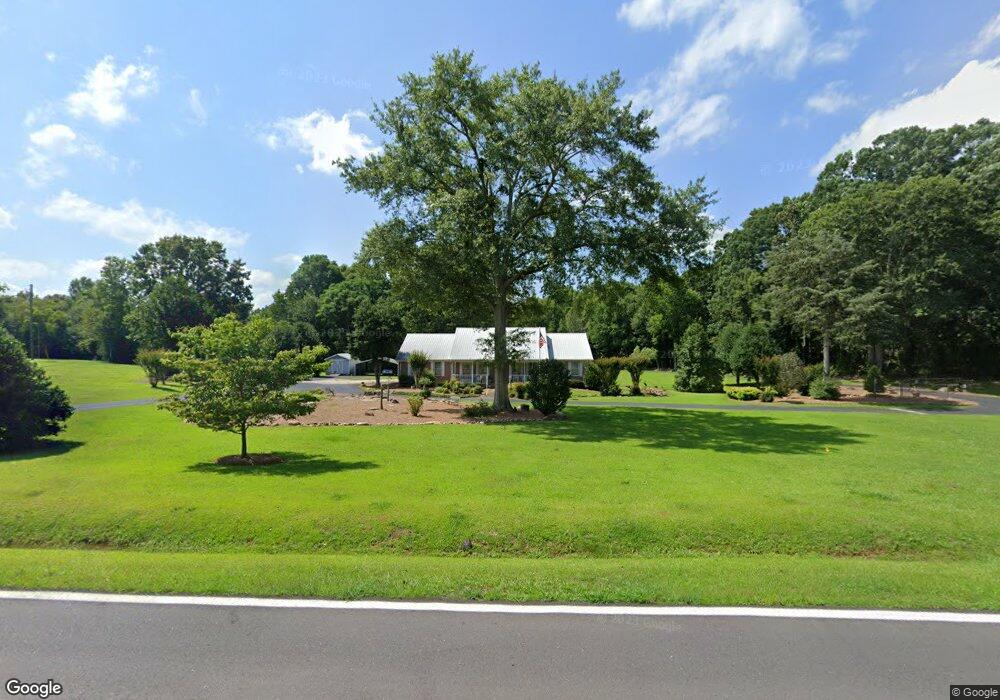
428 Old Kings Bridge Rd Nicholson, GA 30565
Estimated Value: $273,000 - $335,063
3
Beds
2
Baths
2,004
Sq Ft
$156/Sq Ft
Est. Value
About This Home
This home is located at 428 Old Kings Bridge Rd, Nicholson, GA 30565 and is currently estimated at $311,766, approximately $155 per square foot. 428 Old Kings Bridge Rd is a home located in Jackson County with nearby schools including East Jackson Middle School and East Jackson Comprehensive High School.
Ownership History
Date
Name
Owned For
Owner Type
Purchase Details
Closed on
Dec 5, 2005
Sold by
Wallace John Arthur
Bought by
Wallace Anne Onelia
Current Estimated Value
Purchase Details
Closed on
Feb 6, 2001
Sold by
Wilson Wendell and Wilson Cat
Bought by
Wallace John A and Wallace Ann
Purchase Details
Closed on
Aug 24, 1989
Sold by
Wilson Wendell
Bought by
Wilson Wendell and Wilson Cat
Create a Home Valuation Report for This Property
The Home Valuation Report is an in-depth analysis detailing your home's value as well as a comparison with similar homes in the area
Home Values in the Area
Average Home Value in this Area
Purchase History
| Date | Buyer | Sale Price | Title Company |
|---|---|---|---|
| Wallace Anne Onelia | -- | -- | |
| Wallace Anne Onelia | -- | -- | |
| Wallace John A | -- | -- | |
| Wilson Wendell | -- | -- |
Source: Public Records
Tax History Compared to Growth
Tax History
| Year | Tax Paid | Tax Assessment Tax Assessment Total Assessment is a certain percentage of the fair market value that is determined by local assessors to be the total taxable value of land and additions on the property. | Land | Improvement |
|---|---|---|---|---|
| 2024 | $1,725 | $101,560 | $17,240 | $84,320 |
| 2023 | $1,725 | $91,680 | $17,240 | $74,440 |
| 2022 | $1,029 | $68,200 | $9,160 | $59,040 |
| 2021 | $1,012 | $68,200 | $9,160 | $59,040 |
| 2020 | $796 | $58,560 | $9,160 | $49,400 |
| 2019 | $809 | $58,560 | $9,160 | $49,400 |
| 2018 | $774 | $57,076 | $9,160 | $47,916 |
| 2017 | $676 | $54,000 | $9,168 | $44,832 |
| 2016 | $684 | $54,000 | $9,168 | $44,832 |
| 2015 | $913 | $60,798 | $9,168 | $51,630 |
| 2014 | $539 | $50,079 | $9,168 | $40,912 |
| 2013 | -- | $51,566 | $9,167 | $42,398 |
Source: Public Records
Map
Nearby Homes
- 104 Staplers Bridge Rd
- 1192 Old Kings Bridge Rd
- 0 Jefferson Dr Unit 7635823
- 0 Jefferson Dr Unit 10588928
- 0 Birch St Unit 7627498
- 520 Old Athens Dr
- 719 Old Athens Dr
- 5111 U S 441
- 334 Summit Heights Dr
- 301 Summit Heights Dr
- 620 Ivy Creek Dr
- 7 Red Rose Rd
- 9 Red Rose Rd
- 192 Plantation Crossing
- 573 Sanford Dr
- 5246 Us-441 S
- 698 Ivy Creek Dr
- 24 Quail Ridge Dr
- 10 Red Rose Rd
- 0 Sanford Oak Ct Unit 7683746
- 431 Old Kings Bridge Rd
- 36 Stapler Murray Rd
- 419 Old Kings Bridge Rd
- 332 Old Kings Bridge Rd
- 0 Old Kings Bridge Rd Unit CM911046
- 0 Old Kings Bridge Rd Unit 8541054
- 0 Old Kings Bridge Rd Unit 8013024
- 0 Old Kings Bridge Rd Unit 7473636
- 0 Old Kings Bridge Rd Unit 8731534
- 0 Old Kings Bridge Rd Unit 9022656
- 0 Old Kings Bridge Rd Unit 8487952
- 0 Old Kings Bridge Rd Unit 8709025
- 0 Old Kings Bridge Rd Unit 3078088
- 0 Old Kings Bridge Rd Unit 3091177
- 0 Old Kings Bridge Rd Unit 3207867
- 0 Old Kings Bridge Rd Unit 7553004
- 0 Old Kings Bridge Rd Unit 8000958
- 0 Old Kings Bridge Rd Unit 8333871
- 0 Old Kings Bridge Rd Unit 8351380