Estimated Value: $359,101 - $395,000
3
Beds
2
Baths
2,176
Sq Ft
$173/Sq Ft
Est. Value
About This Home
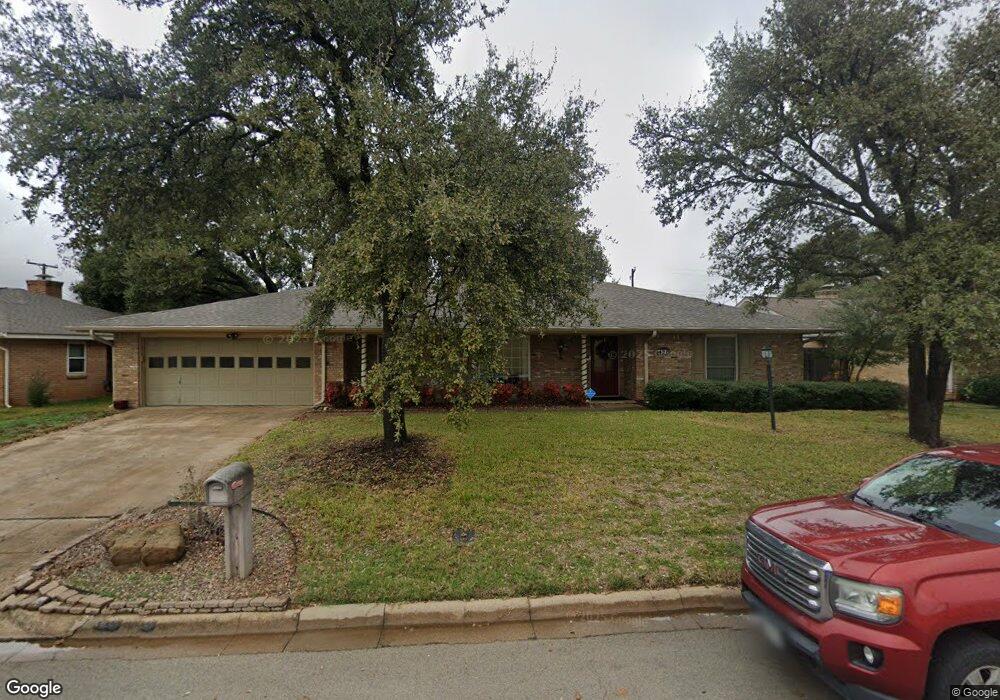
This home is located at 428 Plainview Dr, Hurst, TX 76054 and is currently estimated at $376,275, approximately $172 per square foot. 428 Plainview Dr is a home located in Tarrant County with nearby schools including Shady Oaks Elementary School, Bedford Junior High School, and L.D. Bell High School.
Ownership History
Date
Name
Owned For
Owner Type
Purchase Details
Closed on
Oct 31, 2016
Sold by
Kelly Howard Clifton and Kelly Janet A
Bought by
Culpepper Deanna
Current Estimated Value
Home Financials for this Owner
Home Financials are based on the most recent Mortgage that was taken out on this home.
Original Mortgage
$174,000
Outstanding Balance
$82,684
Interest Rate
3.5%
Mortgage Type
New Conventional
Estimated Equity
$293,591
Purchase Details
Closed on
Aug 8, 2000
Sold by
Ables Imogene M
Bought by
Prince Arthur Richard and Prince Assunta E
Home Financials for this Owner
Home Financials are based on the most recent Mortgage that was taken out on this home.
Original Mortgage
$100,000
Interest Rate
8.22%
Purchase Details
Closed on
Apr 27, 2000
Sold by
Kelly Glynne O and Kelly Bonnie M
Bought by
Ables Imogene M
Create a Home Valuation Report for This Property
The Home Valuation Report is an in-depth analysis detailing your home's value as well as a comparison with similar homes in the area
Home Values in the Area
Average Home Value in this Area
Purchase History
| Date | Buyer | Sale Price | Title Company |
|---|---|---|---|
| Culpepper Deanna | -- | Wfg National Title Co | |
| Prince Arthur Richard | -- | Alamo Title Company | |
| Ables Imogene M | -- | American Title Co |
Source: Public Records
Mortgage History
| Date | Status | Borrower | Loan Amount |
|---|---|---|---|
| Open | Culpepper Deanna | $174,000 | |
| Previous Owner | Prince Arthur Richard | $100,000 |
Source: Public Records
Tax History Compared to Growth
Tax History
| Year | Tax Paid | Tax Assessment Tax Assessment Total Assessment is a certain percentage of the fair market value that is determined by local assessors to be the total taxable value of land and additions on the property. | Land | Improvement |
|---|---|---|---|---|
| 2025 | $2,386 | $272,815 | $80,000 | $192,815 |
| 2024 | $2,386 | $272,815 | $80,000 | $192,815 |
| 2023 | $5,146 | $277,669 | $55,000 | $222,669 |
| 2022 | $5,376 | $233,496 | $55,000 | $178,496 |
| 2021 | $5,236 | $217,101 | $55,000 | $162,101 |
| 2020 | $6,015 | $250,000 | $55,000 | $195,000 |
| 2019 | $6,119 | $250,000 | $55,000 | $195,000 |
| 2018 | $3,931 | $233,516 | $55,000 | $178,516 |
| 2017 | $5,372 | $212,287 | $40,000 | $172,287 |
| 2014 | $3,082 | $134,200 | $17,000 | $117,200 |
Source: Public Records
Map
Nearby Homes
- 425 W Pleasantview Dr
- 521 Brookview Dr
- 608 W Pleasantview Dr
- 229 Brookview Dr
- 520 Baker Dr
- 440 W Louella Dr
- 1625 Oak Creek Dr
- 1337 Harrison Ln
- 100 Hillview Ct
- 1352 Simpson Dr
- 113 Sunnyvale Terrace
- 1348 Norwood Dr
- 116 Oakhurst Dr
- 409 Vicki Place
- 1208 Karla Dr
- 1208 Birch St
- 813 Overhill Ct
- 1220 Norwood Dr
- 421 Cavender Ct
- 420 Bedford Ct W
- 432 Plainview Dr
- 424 Plainview Dr
- 429 Brookview Dr
- 433 Brookview Dr
- 425 Brookview Dr
- 436 Plainview Dr
- 420 Plainview Dr
- 437 Brookview Dr
- 421 Brookview Dr
- 440 Plainview Dr
- 416 Plainview Dr
- 441 Brookview Dr
- 417 Brookview Dr
- 428 Brookview Dr
- 432 Brookview Dr
- 424 Brookview Dr
- 444 Plainview Dr
- 436 Brookview Dr
- 420 Brookview Dr
- 412 Plainview Dr