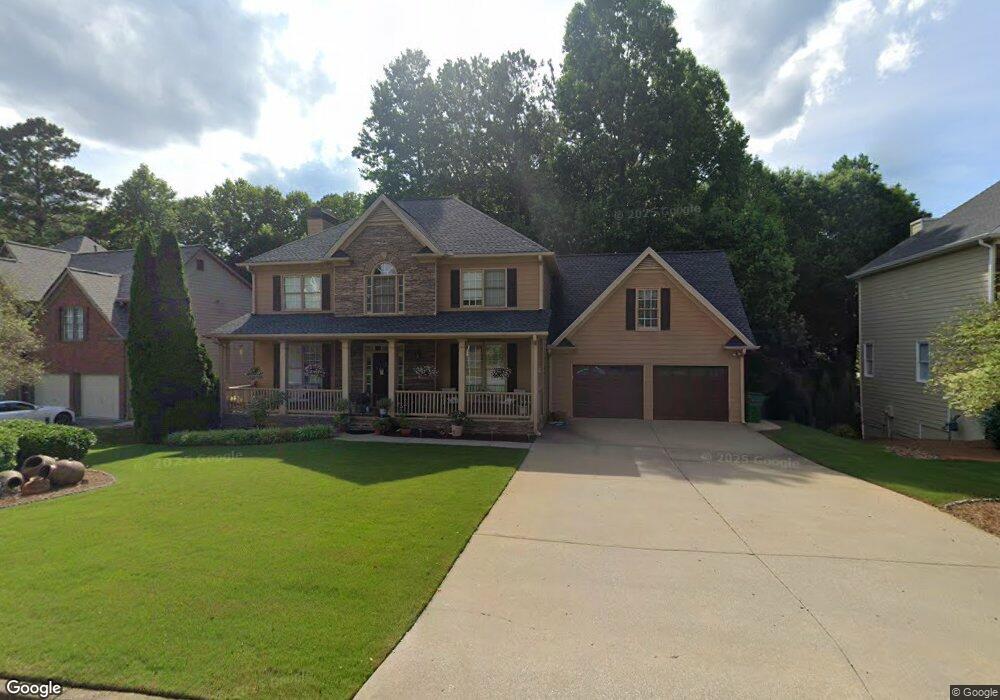
428 Redfield Dr Unit 2 Canton, GA 30114
Oak Grove NeighborhoodEstimated Value: $514,000 - $532,266
4
Beds
3
Baths
2,884
Sq Ft
$181/Sq Ft
Est. Value
About This Home
This home is located at 428 Redfield Dr Unit 2, Canton, GA 30114 and is currently estimated at $523,133, approximately $181 per square foot. 428 Redfield Dr Unit 2 is a home located in Cherokee County with nearby schools including Sixes Elementary School, Freedom Middle School, and Woodstock High School.
Ownership History
Date
Name
Owned For
Owner Type
Purchase Details
Closed on
Jul 11, 2025
Sold by
Avis Tracey L
Bought by
Lohlein Michael Gerard
Current Estimated Value
Purchase Details
Closed on
Jan 10, 2023
Sold by
Avis Tracey L
Bought by
Avis Tracey L and Lohlein Michael G
Purchase Details
Closed on
Mar 25, 2008
Sold by
Bank Of North Georgia
Bought by
Colbert Joseph
Purchase Details
Closed on
Oct 30, 2001
Sold by
Colbert Joseph
Bought by
Avis Tracey L
Home Financials for this Owner
Home Financials are based on the most recent Mortgage that was taken out on this home.
Original Mortgage
$205,000
Interest Rate
6.49%
Purchase Details
Closed on
Jan 20, 2001
Sold by
Cordell Construction Inc
Bought by
Colbert Joseph
Home Financials for this Owner
Home Financials are based on the most recent Mortgage that was taken out on this home.
Original Mortgage
$197,000
Interest Rate
7.53%
Mortgage Type
New Conventional
Create a Home Valuation Report for This Property
The Home Valuation Report is an in-depth analysis detailing your home's value as well as a comparison with similar homes in the area
Home Values in the Area
Average Home Value in this Area
Purchase History
| Date | Buyer | Sale Price | Title Company |
|---|---|---|---|
| Lohlein Michael Gerard | -- | -- | |
| Avis Tracey L | -- | -- | |
| Colbert Joseph | -- | -- | |
| Avis Tracey L | $230,000 | -- | |
| Colbert Joseph | $194,000 | -- |
Source: Public Records
Mortgage History
| Date | Status | Borrower | Loan Amount |
|---|---|---|---|
| Previous Owner | Avis Tracey L | $205,000 | |
| Previous Owner | Colbert Joseph | $197,000 |
Source: Public Records
Tax History
| Year | Tax Paid | Tax Assessment Tax Assessment Total Assessment is a certain percentage of the fair market value that is determined by local assessors to be the total taxable value of land and additions on the property. | Land | Improvement |
|---|---|---|---|---|
| 2025 | $4,712 | $200,280 | $41,200 | $159,080 |
| 2024 | $4,780 | $205,200 | $44,800 | $160,400 |
| 2023 | $4,162 | $196,516 | $41,600 | $154,916 |
| 2022 | $3,807 | $156,836 | $32,000 | $124,836 |
| 2021 | $3,673 | $137,480 | $26,640 | $110,840 |
| 2020 | $3,389 | $125,120 | $24,000 | $101,120 |
| 2019 | $3,127 | $113,840 | $20,800 | $93,040 |
| 2018 | $3,048 | $109,720 | $20,800 | $88,920 |
| 2017 | $2,942 | $260,900 | $20,800 | $83,560 |
| 2016 | $2,672 | $235,200 | $20,000 | $74,080 |
| 2015 | $2,530 | $220,900 | $20,000 | $68,360 |
| 2014 | $2,447 | $213,400 | $20,000 | $65,360 |
Source: Public Records
Map
Nearby Homes
- 325 Gold Ridge
- 0 Sixes Creek Trail Unit 7197452
- 641 E Shore Dr
- 190 Sixes Creek Trail
- 187 Sixes Creek Trail
- 2785 Sixes Rd
- 1012 Blankets Creek Dr
- 1600 Sixes Rd
- 206 Sawtooth Ct
- 305 Ridge Rd
- 779 Holly St
- 423 Crestmont Ln
- 417 Crestmont Ln
- 1520 Timber Trace
- 517 Kensington Park Dr Unit 3
- 159 Oak Hill Cir
- 103 Prominence Ct
- 2550 Mountain Brook Rd
- 1415 Sixes Rd
- 151 Prominence Ct
- 424 Redfield Dr Unit II
- 432 Redfield Dr Unit 2
- 1072 Copper Creek Dr
- 1060 Copper Creek Dr
- 205 Silver Walk Unit 1
- 420 Redfield Dr
- 436 Redfield Dr Unit 2
- 1064 Copper Creek Dr Unit 1
- 1068 Copper Creek Dr
- 439 Redfield Dr Unit 2
- 435 Redfield Dr
- 1056 Copper Creek Dr Unit 1
- 500 Ruby Ln
- 440 Redfield Dr
- 1080 Copper Creek Dr
- 445 Redfield Dr
- 208 Silver Walk Unit 1
- 416 Redfield Dr Unit 1
- 505 Ruby Ln
- 504 Ruby Ln
Your Personal Tour Guide
Ask me questions while you tour the home.