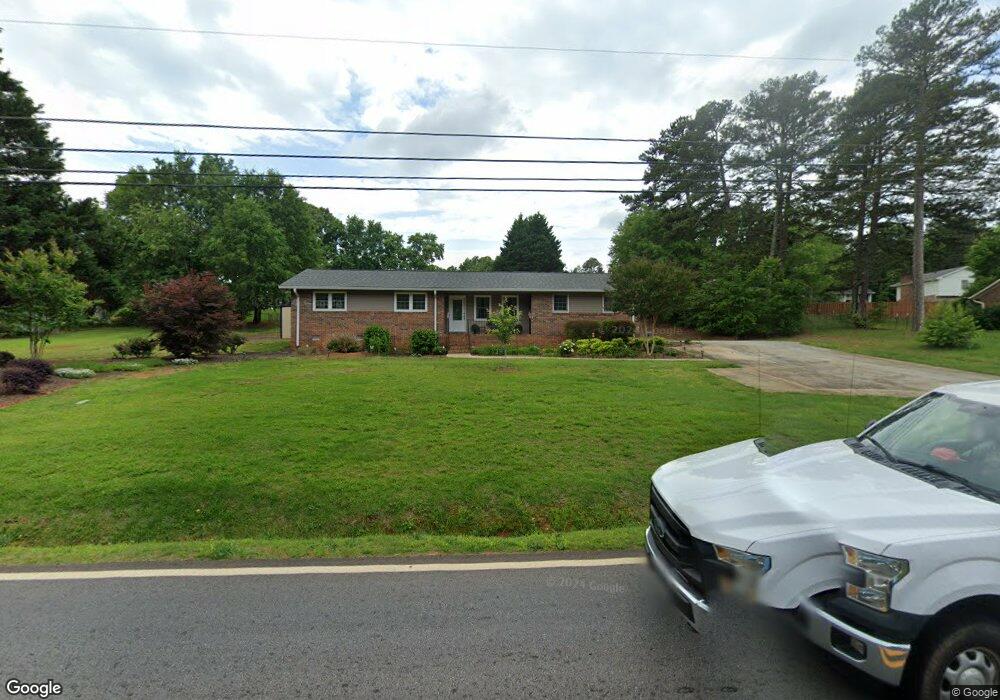
428 Rock Creek Rd Toccoa, GA 30577
Estimated Value: $224,000 - $275,000
3
Beds
2
Baths
1,054
Sq Ft
$240/Sq Ft
Est. Value
About This Home
This home is located at 428 Rock Creek Rd, Toccoa, GA 30577 and is currently estimated at $252,490, approximately $239 per square foot. 428 Rock Creek Rd is a home located in Stephens County with nearby schools including Stephens County High School.
Ownership History
Date
Name
Owned For
Owner Type
Purchase Details
Closed on
Feb 21, 2022
Sold by
Freeman Charlie J
Bought by
Freeman Charlie J and Freeman Brian
Current Estimated Value
Purchase Details
Closed on
Feb 19, 2019
Sold by
Johnston Sid Albert
Bought by
Freeman Charlie J
Home Financials for this Owner
Home Financials are based on the most recent Mortgage that was taken out on this home.
Original Mortgage
$133,950
Interest Rate
4.4%
Mortgage Type
New Conventional
Purchase Details
Closed on
Jan 26, 2017
Bought by
Johnston Sid Albert
Purchase Details
Closed on
Sep 6, 2016
Sold by
Faith A
Bought by
Wells Fargo Bank
Purchase Details
Closed on
Oct 1, 1993
Bought by
<Buyer Info Not Present>
Purchase Details
Closed on
Jul 1, 1991
Bought by
<Buyer Info Not Present>
Create a Home Valuation Report for This Property
The Home Valuation Report is an in-depth analysis detailing your home's value as well as a comparison with similar homes in the area
Home Values in the Area
Average Home Value in this Area
Purchase History
| Date | Buyer | Sale Price | Title Company |
|---|---|---|---|
| Freeman Charlie J | -- | -- | |
| Freeman Charlie J | $141,000 | -- | |
| Johnston Sid Albert | $51,000 | -- | |
| Wells Fargo Bank | -- | -- | |
| <Buyer Info Not Present> | $50,100 | -- | |
| <Buyer Info Not Present> | $40,000 | -- |
Source: Public Records
Mortgage History
| Date | Status | Borrower | Loan Amount |
|---|---|---|---|
| Previous Owner | Freeman Charlie J | $133,950 |
Source: Public Records
Tax History Compared to Growth
Tax History
| Year | Tax Paid | Tax Assessment Tax Assessment Total Assessment is a certain percentage of the fair market value that is determined by local assessors to be the total taxable value of land and additions on the property. | Land | Improvement |
|---|---|---|---|---|
| 2024 | $857 | $63,214 | $7,386 | $55,828 |
| 2023 | $725 | $59,242 | $7,386 | $51,856 |
| 2022 | $633 | $56,153 | $7,386 | $48,767 |
| 2021 | $549 | $52,458 | $7,386 | $45,072 |
| 2020 | $522 | $51,433 | $7,386 | $44,047 |
| 2019 | $1,388 | $43,765 | $7,386 | $36,379 |
| 2018 | $486 | $15,313 | $7,386 | $7,927 |
| 2017 | $493 | $23,103 | $7,386 | $15,717 |
| 2016 | $991 | $33,254 | $7,385 | $25,869 |
| 2015 | $1,038 | $33,259 | $7,385 | $25,873 |
| 2014 | $1,065 | $33,546 | $7,386 | $26,160 |
| 2013 | -- | $33,545 | $7,385 | $26,160 |
Source: Public Records
Map
Nearby Homes
- 3089 Georgia 17 Alternate
- 3013 Hwy 17 A
- 151 Rock Creek Rd
- 54 Stonewood Forest Rd
- 0 Brookhaven Cir Unit 10616964
- 490 Addington Dr
- 919 Deer Chase Rd
- 668 Brookdale Rd
- 140 Julia Ct
- 5.10 ACRES Hwy 123
- 136 Julia Ct
- 189 Julia Ln
- 297 Ayers Creek Dr
- 327 Ayers Creek Dr
- 405 Ayers Creek Dr
- 535 Deer Chase
- 56 Crawford Manor Dr
- 475 Hilltop Way
- 672 Crawford Cir
- 372 Hilltop Way
- 287 van Mar Dr
- 205 van Mar Dr
- 418 Rock Creek Rd
- 171 van Mar Dr
- 171 van Mar Dr Unit 9
- 467 Rock Creek Rd
- 240 van Mar Dr
- 208 van Mar Dr
- 131 van Mar Dr
- 390 Rock Creek Rd
- 292 van Mar Dr
- 503 Rock Creek Rd
- 176 van Mar Dr
- 184 van Mar Dr
- 99 van Mar Dr
- 15.96 ACRES Rock Creek Rd
- 00 Rock Creek Rd
- 356 Rock Creek Rd
- 0 Vanmar Dr Unit 8525745
- 0 Vanmar Dr Unit 8502501