428 S 19th St Richmond, IN 47374
Estimated Value: $211,000 - $246,000
3
Beds
3
Baths
1,834
Sq Ft
$124/Sq Ft
Est. Value
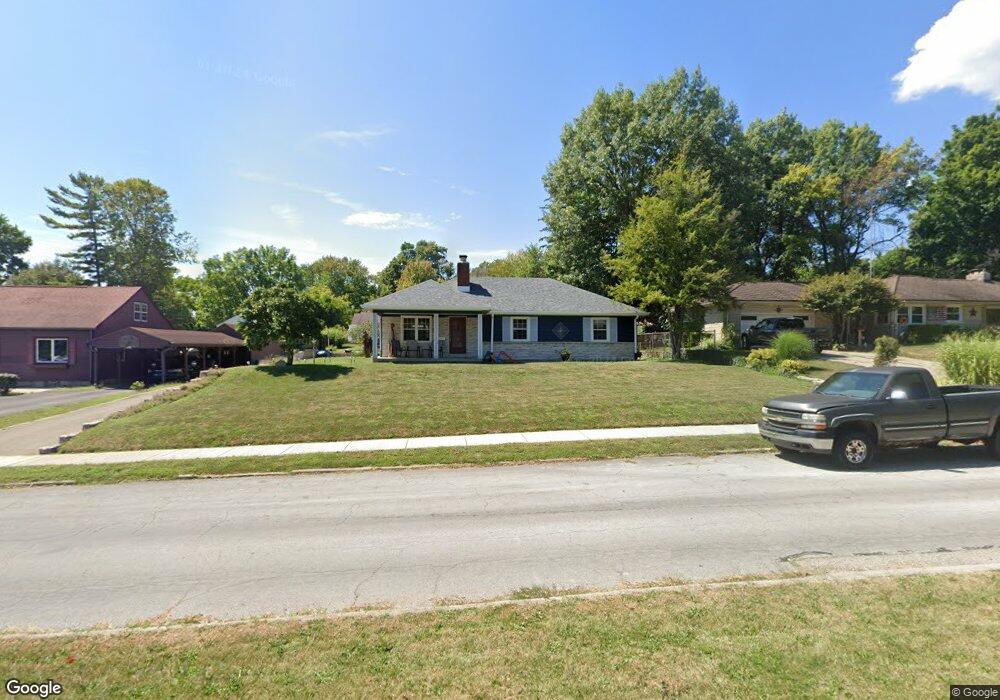
About This Home
This home is located at 428 S 19th St, Richmond, IN 47374 and is currently estimated at $226,694, approximately $123 per square foot. 428 S 19th St is a home located in Wayne County with nearby schools including Charles Elementary School, Julia E. Test Intermediate School, and Richmond High School.
Ownership History
Date
Name
Owned For
Owner Type
Purchase Details
Closed on
Jul 12, 2019
Sold by
Fryman David E Est
Bought by
Hittle Thomas S and Hittle Donna T
Current Estimated Value
Purchase Details
Closed on
Mar 30, 2006
Sold by
Griffis Virginia L
Bought by
Fryman David E and Fryman Suzanne C
Home Financials for this Owner
Home Financials are based on the most recent Mortgage that was taken out on this home.
Original Mortgage
$42,000
Interest Rate
6.34%
Mortgage Type
New Conventional
Purchase Details
Closed on
Jun 16, 2005
Sold by
Griffis Virginia L
Bought by
Griffis Virginia L and Virginia L Griffis Revocable Living Trus
Create a Home Valuation Report for This Property
The Home Valuation Report is an in-depth analysis detailing your home's value as well as a comparison with similar homes in the area
Home Values in the Area
Average Home Value in this Area
Purchase History
| Date | Buyer | Sale Price | Title Company |
|---|---|---|---|
| Hittle Thomas S | -- | -- | |
| Fryman David E | -- | -- | |
| Griffis Virginia L | -- | -- |
Source: Public Records
Mortgage History
| Date | Status | Borrower | Loan Amount |
|---|---|---|---|
| Previous Owner | Fryman David E | $42,000 |
Source: Public Records
Tax History Compared to Growth
Tax History
| Year | Tax Paid | Tax Assessment Tax Assessment Total Assessment is a certain percentage of the fair market value that is determined by local assessors to be the total taxable value of land and additions on the property. | Land | Improvement |
|---|---|---|---|---|
| 2024 | $1,570 | $157,000 | $43,100 | $113,900 |
| 2023 | $1,376 | $137,600 | $37,800 | $99,800 |
| 2022 | $1,387 | $138,700 | $37,800 | $100,900 |
| 2021 | $1,282 | $128,200 | $37,800 | $90,400 |
| 2020 | $1,282 | $128,200 | $37,800 | $90,400 |
| 2019 | $1,241 | $124,100 | $37,800 | $86,300 |
| 2018 | $1,241 | $124,100 | $37,800 | $86,300 |
| 2017 | $1,230 | $123,000 | $37,800 | $85,200 |
| 2016 | $1,230 | $123,000 | $37,800 | $85,200 |
| 2014 | $1,225 | $122,500 | $37,800 | $84,700 |
| 2013 | $1,225 | $123,400 | $37,800 | $85,600 |
Source: Public Records
Map
Nearby Homes