Estimated Value: $374,000 - $422,000
4
Beds
2
Baths
1,872
Sq Ft
$213/Sq Ft
Est. Value
About This Home
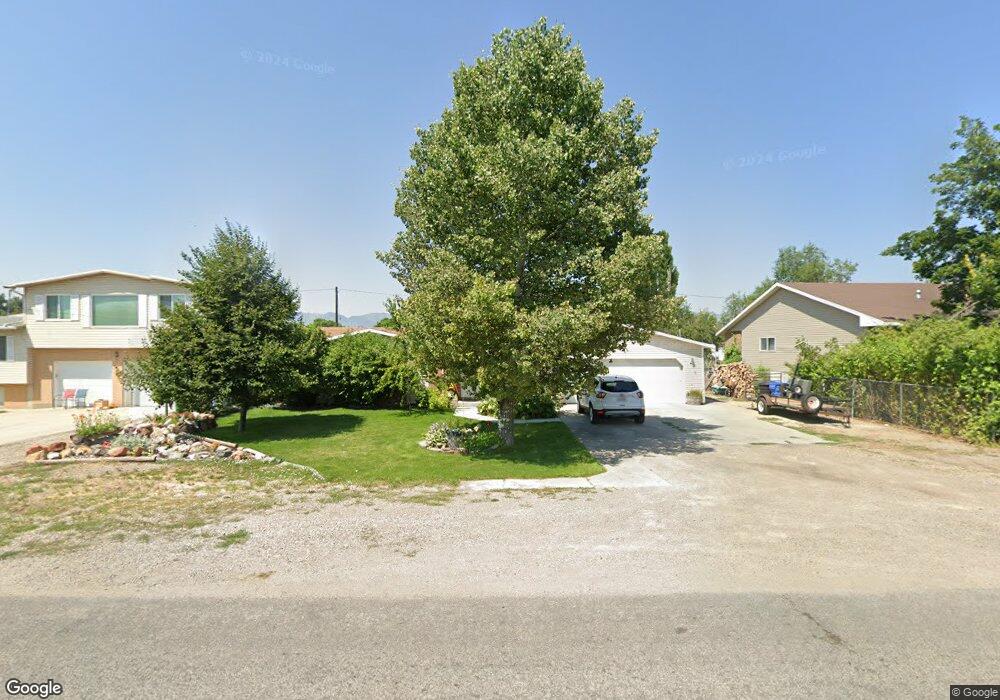
This home is located at 428 S 200 E, Hyrum, UT 84319 and is currently estimated at $398,079, approximately $212 per square foot. 428 S 200 E is a home located in Cache County with nearby schools including Canyon School, South Cache Middle School, and Mountain Crest High School.
Ownership History
Date
Name
Owned For
Owner Type
Purchase Details
Closed on
Nov 3, 2022
Sold by
Allgood Scot M and Allgood Julie Kay
Bought by
Scot And Julie Allgood Revocable Living Trust and Allgood
Current Estimated Value
Purchase Details
Closed on
Apr 28, 2005
Sold by
Mabey Christopher A and Mabey Katrina
Bought by
Allgood Scot M and Allgood Julie K
Home Financials for this Owner
Home Financials are based on the most recent Mortgage that was taken out on this home.
Original Mortgage
$75,000
Interest Rate
5.92%
Mortgage Type
New Conventional
Create a Home Valuation Report for This Property
The Home Valuation Report is an in-depth analysis detailing your home's value as well as a comparison with similar homes in the area
Home Values in the Area
Average Home Value in this Area
Purchase History
| Date | Buyer | Sale Price | Title Company |
|---|---|---|---|
| Scot And Julie Allgood Revocable Living Trust | -- | None Listed On Document | |
| Allgood Scot M | -- | Cache Title Company |
Source: Public Records
Mortgage History
| Date | Status | Borrower | Loan Amount |
|---|---|---|---|
| Previous Owner | Allgood Scot M | $75,000 |
Source: Public Records
Tax History
| Year | Tax Paid | Tax Assessment Tax Assessment Total Assessment is a certain percentage of the fair market value that is determined by local assessors to be the total taxable value of land and additions on the property. | Land | Improvement |
|---|---|---|---|---|
| 2025 | $1,507 | $216,350 | $0 | $0 |
| 2024 | $163 | $218,665 | $0 | $0 |
| 2023 | $1,661 | $212,955 | $0 | $0 |
| 2022 | $1,733 | $212,955 | $0 | $0 |
| 2021 | $1,653 | $312,850 | $65,050 | $247,800 |
| 2020 | $1,529 | $271,550 | $65,050 | $206,500 |
| 2019 | $1,401 | $234,125 | $38,000 | $196,125 |
| 2018 | $1,264 | $204,208 | $38,000 | $166,208 |
| 2017 | $1,223 | $102,520 | $0 | $0 |
| 2016 | $1,251 | $86,680 | $0 | $0 |
| 2015 | $1,060 | $86,680 | $0 | $0 |
| 2014 | $1,002 | $83,745 | $0 | $0 |
| 2013 | -- | $70,445 | $0 | $0 |
Source: Public Records
Map
Nearby Homes
Your Personal Tour Guide
Ask me questions while you tour the home.