Estimated Value: $182,000 - $186,000
3
Beds
1
Bath
1,068
Sq Ft
$171/Sq Ft
Est. Value
About This Home
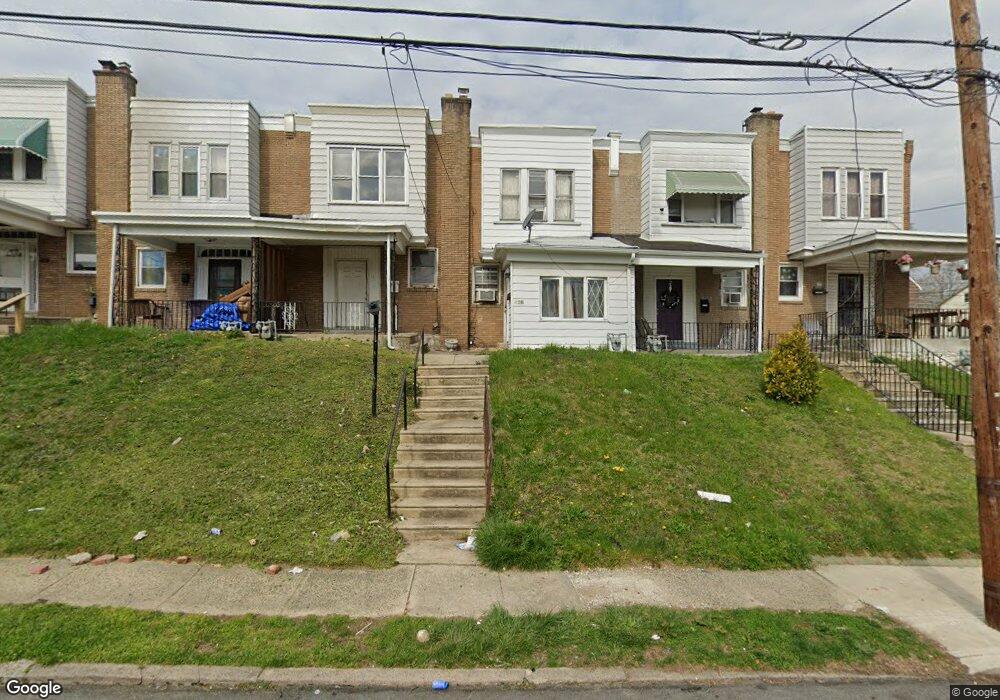
This home is located at 428 S 2nd St Unit B, Darby, PA 19023 and is currently estimated at $183,076, approximately $171 per square foot. 428 S 2nd St Unit B is a home located in Delaware County with nearby schools including Colwyn Elementary School, Penn Wood Middle School, and Penn Wood High School - Cypress Street Campus.
Ownership History
Date
Name
Owned For
Owner Type
Purchase Details
Closed on
Jun 27, 2024
Sold by
Tore Properties Llc
Bought by
King & Queen Real Estate Llc
Current Estimated Value
Home Financials for this Owner
Home Financials are based on the most recent Mortgage that was taken out on this home.
Original Mortgage
$117,000
Interest Rate
6.94%
Mortgage Type
Construction
Purchase Details
Closed on
Jun 13, 2014
Sold by
Sacker Ali and Kaba Janet M
Bought by
Tore Properties Llc
Purchase Details
Closed on
Oct 7, 2002
Sold by
Thomas Kenneth H and Thomas Catherine M
Bought by
Sacker Ali and Kaba Janet M
Home Financials for this Owner
Home Financials are based on the most recent Mortgage that was taken out on this home.
Original Mortgage
$50,015
Interest Rate
6.24%
Mortgage Type
FHA
Create a Home Valuation Report for This Property
The Home Valuation Report is an in-depth analysis detailing your home's value as well as a comparison with similar homes in the area
Home Values in the Area
Average Home Value in this Area
Purchase History
| Date | Buyer | Sale Price | Title Company |
|---|---|---|---|
| King & Queen Real Estate Llc | $87,500 | None Listed On Document | |
| Tore Properties Llc | $5,328 | None Available | |
| Sacker Ali | $49,900 | Commonwealth Land Title Ins |
Source: Public Records
Mortgage History
| Date | Status | Borrower | Loan Amount |
|---|---|---|---|
| Closed | King & Queen Real Estate Llc | $117,000 | |
| Previous Owner | Sacker Ali | $50,015 |
Source: Public Records
Tax History Compared to Growth
Tax History
| Year | Tax Paid | Tax Assessment Tax Assessment Total Assessment is a certain percentage of the fair market value that is determined by local assessors to be the total taxable value of land and additions on the property. | Land | Improvement |
|---|---|---|---|---|
| 2025 | $2,820 | $54,150 | $12,140 | $42,010 |
| 2024 | $2,820 | $54,150 | $12,140 | $42,010 |
| 2023 | $1,730 | $54,150 | $12,140 | $42,010 |
| 2022 | $2,674 | $54,150 | $12,140 | $42,010 |
| 2021 | $3,698 | $54,150 | $12,140 | $42,010 |
| 2020 | $2,636 | $33,900 | $15,780 | $18,120 |
| 2019 | $2,599 | $33,900 | $15,780 | $18,120 |
| 2018 | $2,570 | $33,900 | $0 | $0 |
| 2017 | $2,527 | $33,900 | $0 | $0 |
| 2016 | $190 | $33,900 | $0 | $0 |
| 2015 | $190 | $49,520 | $0 | $0 |
| 2014 | $277 | $49,520 | $0 | $0 |
Source: Public Records
Map
Nearby Homes