Estimated Value: $95,000 - $148,000
4
Beds
2
Baths
980
Sq Ft
$122/Sq Ft
Est. Value
About This Home
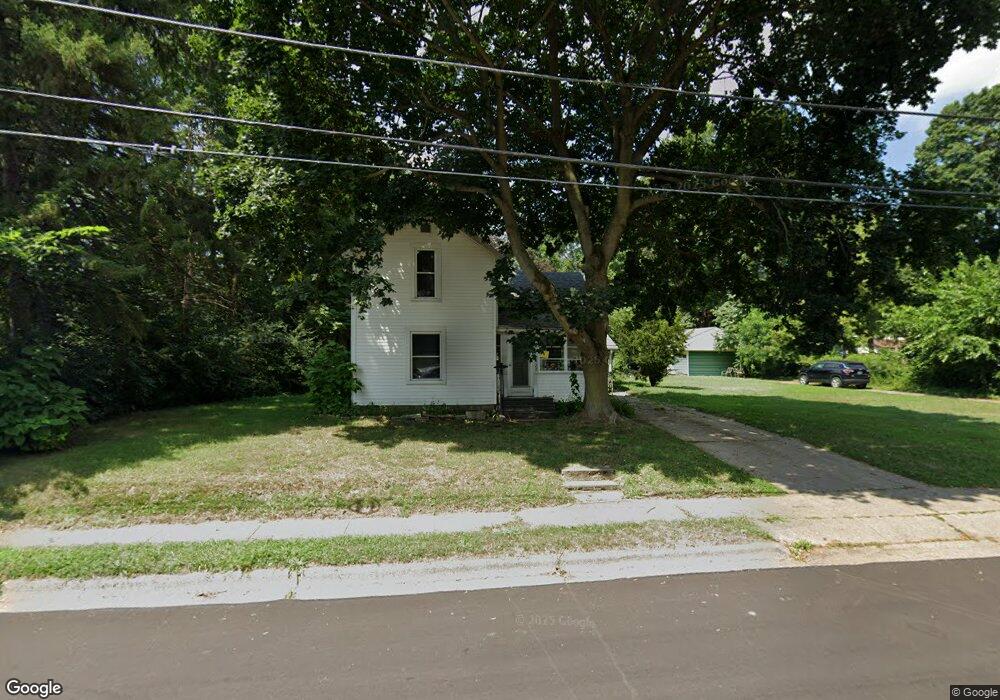
This home is located at 428 S 9th St, Niles, MI 49120 and is currently estimated at $119,160, approximately $121 per square foot. 428 S 9th St is a home located in Berrien County with nearby schools including Ballard Elementary School, Oak Manor Sixth Grade Center, and Ring Lardner Middle School.
Ownership History
Date
Name
Owned For
Owner Type
Purchase Details
Closed on
Nov 1, 2010
Sold by
The Secretary Of Veterans Affairs
Bought by
Linville Jeff
Current Estimated Value
Purchase Details
Closed on
Dec 15, 2009
Sold by
Mvb Mortgage Corporation
Bought by
Department Of Veterans Affairs
Purchase Details
Closed on
Nov 19, 2009
Sold by
Waggoner Robert P
Bought by
Mvb Mortgage Corporation
Purchase Details
Closed on
May 22, 2002
Create a Home Valuation Report for This Property
The Home Valuation Report is an in-depth analysis detailing your home's value as well as a comparison with similar homes in the area
Home Values in the Area
Average Home Value in this Area
Purchase History
We collect this data history from publicly available records. To have your information removed, we recommend requesting removal directly through your county’s website.
| Date | Buyer | Sale Price | Title Company |
|---|---|---|---|
| Linville Jeff | $10,500 | Multiple | |
| Department Of Veterans Affairs | -- | None Available | |
| Mvb Mortgage Corporation | $28,201 | None Available | |
| -- | $68,000 | -- |
Source: Public Records
Tax History
| Year | Tax Paid | Tax Assessment Tax Assessment Total Assessment is a certain percentage of the fair market value that is determined by local assessors to be the total taxable value of land and additions on the property. | Land | Improvement |
|---|---|---|---|---|
| 2025 | $1,185 | $47,000 | $0 | $0 |
| 2024 | $619 | $43,000 | $0 | $0 |
| 2023 | $593 | $29,800 | $0 | $0 |
| 2022 | $565 | $27,600 | $0 | $0 |
| 2021 | $1,035 | $25,700 | $4,100 | $21,600 |
| 2020 | $1,023 | $19,800 | $0 | $0 |
| 2019 | $1,008 | $27,100 | $11,200 | $15,900 |
| 2018 | $972 | $27,100 | $0 | $0 |
| 2017 | $961 | $19,200 | $0 | $0 |
| 2016 | $944 | $17,900 | $0 | $0 |
| 2015 | $942 | $17,300 | $0 | $0 |
| 2014 | $491 | $17,300 | $0 | $0 |
Source: Public Records
Map
Nearby Homes
Your Personal Tour Guide
Ask me questions while you tour the home.