Estimated Value: $167,969 - $198,000
4
Beds
1
Bath
1,529
Sq Ft
$123/Sq Ft
Est. Value
About This Home
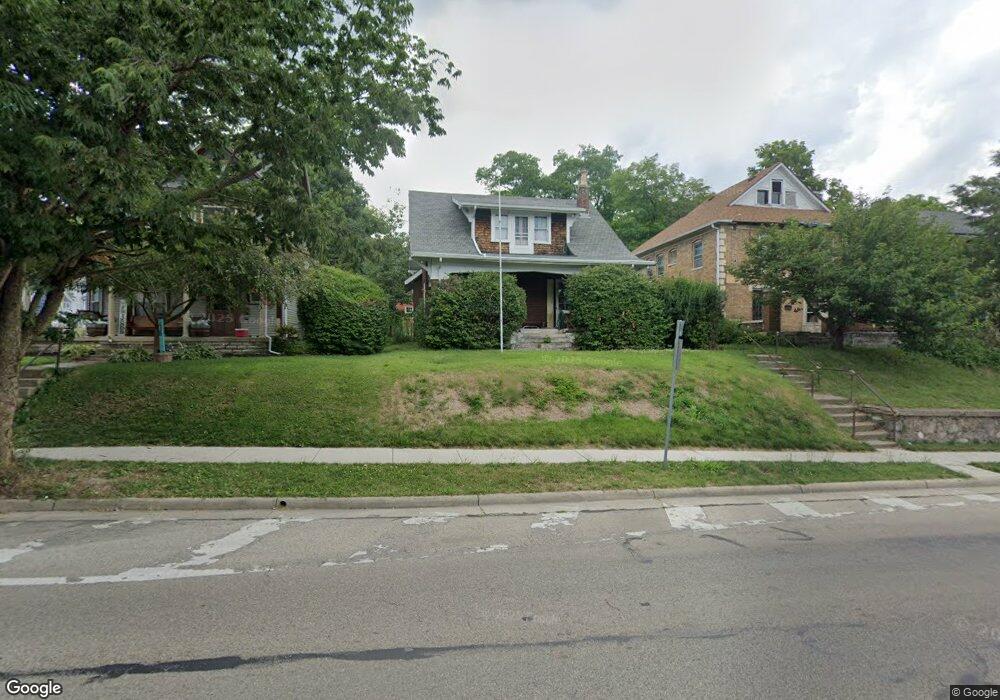
This home is located at 428 S Detroit St, Xenia, OH 45385 and is currently estimated at $187,742, approximately $122 per square foot. 428 S Detroit St is a home located in Greene County with nearby schools including Xenia High School, Summit Academy Community School for Alternative Learners - Xenia, and Legacy Christian Academy.
Ownership History
Date
Name
Owned For
Owner Type
Purchase Details
Closed on
May 31, 2000
Sold by
Grooms Ian and Grooms Becky A
Bought by
Mcpeek James A
Current Estimated Value
Home Financials for this Owner
Home Financials are based on the most recent Mortgage that was taken out on this home.
Original Mortgage
$78,950
Outstanding Balance
$27,674
Interest Rate
8.14%
Mortgage Type
FHA
Estimated Equity
$160,068
Purchase Details
Closed on
Jan 12, 2000
Sold by
Grooms Becky A and Karkan Becky A
Bought by
Grooms Ian
Home Financials for this Owner
Home Financials are based on the most recent Mortgage that was taken out on this home.
Original Mortgage
$28,000
Interest Rate
7.89%
Purchase Details
Closed on
May 20, 1999
Sold by
Combs Lloyd O and Combs Joyce L
Bought by
Karkan Becky A
Home Financials for this Owner
Home Financials are based on the most recent Mortgage that was taken out on this home.
Original Mortgage
$54,900
Interest Rate
6.92%
Create a Home Valuation Report for This Property
The Home Valuation Report is an in-depth analysis detailing your home's value as well as a comparison with similar homes in the area
Home Values in the Area
Average Home Value in this Area
Purchase History
| Date | Buyer | Sale Price | Title Company |
|---|---|---|---|
| Mcpeek James A | $80,000 | -- | |
| Grooms Ian | -- | -- | |
| Karkan Becky A | $54,900 | -- |
Source: Public Records
Mortgage History
| Date | Status | Borrower | Loan Amount |
|---|---|---|---|
| Open | Mcpeek James A | $78,950 | |
| Previous Owner | Grooms Ian | $28,000 | |
| Previous Owner | Karkan Becky A | $54,900 |
Source: Public Records
Tax History Compared to Growth
Tax History
| Year | Tax Paid | Tax Assessment Tax Assessment Total Assessment is a certain percentage of the fair market value that is determined by local assessors to be the total taxable value of land and additions on the property. | Land | Improvement |
|---|---|---|---|---|
| 2024 | $1,841 | $43,020 | $4,760 | $38,260 |
| 2023 | $1,841 | $43,020 | $4,760 | $38,260 |
| 2022 | $1,633 | $32,550 | $3,810 | $28,740 |
| 2021 | $1,655 | $32,550 | $3,810 | $28,740 |
| 2020 | $1,586 | $32,550 | $3,810 | $28,740 |
| 2019 | $1,382 | $26,700 | $3,930 | $22,770 |
| 2018 | $1,387 | $26,700 | $3,930 | $22,770 |
| 2017 | $1,327 | $26,700 | $3,930 | $22,770 |
| 2016 | $1,327 | $25,070 | $3,930 | $21,140 |
| 2015 | $1,331 | $25,070 | $3,930 | $21,140 |
| 2014 | $1,274 | $25,070 | $3,930 | $21,140 |
Source: Public Records
Map
Nearby Homes