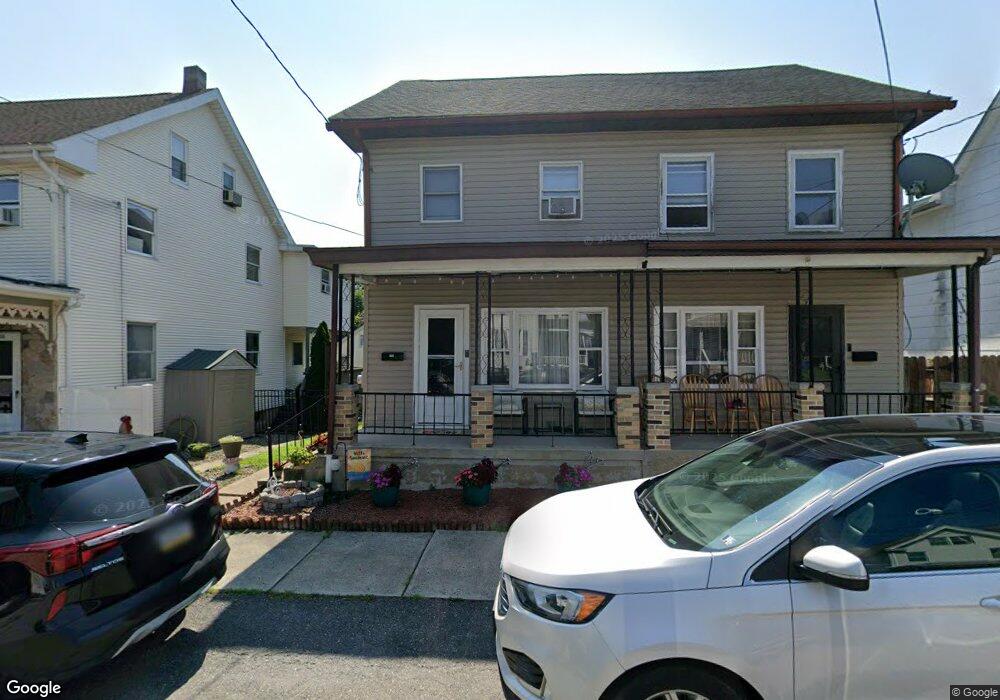
428 South St Jim Thorpe, PA 18229
Estimated Value: $169,000 - $232,000
4
Beds
1
Bath
1,384
Sq Ft
$141/Sq Ft
Est. Value
About This Home
This home is located at 428 South St, Jim Thorpe, PA 18229 and is currently estimated at $195,294, approximately $141 per square foot. 428 South St is a home located in Carbon County with nearby schools including Jim Thorpe Area High School.
Ownership History
Date
Name
Owned For
Owner Type
Purchase Details
Closed on
May 28, 2019
Sold by
Bekesy Robert A
Bought by
Coppolecchia Melissa
Current Estimated Value
Home Financials for this Owner
Home Financials are based on the most recent Mortgage that was taken out on this home.
Original Mortgage
$118,340
Outstanding Balance
$104,050
Interest Rate
4.1%
Mortgage Type
Reverse Mortgage Home Equity Conversion Mortgage
Estimated Equity
$91,244
Purchase Details
Closed on
Jan 19, 2004
Bought by
Bekesy Robert A
Create a Home Valuation Report for This Property
The Home Valuation Report is an in-depth analysis detailing your home's value as well as a comparison with similar homes in the area
Home Values in the Area
Average Home Value in this Area
Purchase History
| Date | Buyer | Sale Price | Title Company |
|---|---|---|---|
| Coppolecchia Melissa | $122,000 | Carbon Search & Setmnt Svcs | |
| Bekesy Robert A | -- | -- |
Source: Public Records
Mortgage History
| Date | Status | Borrower | Loan Amount |
|---|---|---|---|
| Open | Coppolecchia Melissa | $118,340 |
Source: Public Records
Tax History Compared to Growth
Tax History
| Year | Tax Paid | Tax Assessment Tax Assessment Total Assessment is a certain percentage of the fair market value that is determined by local assessors to be the total taxable value of land and additions on the property. | Land | Improvement |
|---|---|---|---|---|
| 2025 | $2,992 | $37,700 | $9,250 | $28,450 |
| 2024 | $2,879 | $37,700 | $9,250 | $28,450 |
| 2023 | $2,827 | $37,700 | $9,250 | $28,450 |
| 2022 | $2,782 | $37,700 | $9,250 | $28,450 |
| 2021 | $2,782 | $37,700 | $9,250 | $28,450 |
| 2020 | $2,685 | $37,700 | $9,250 | $28,450 |
| 2019 | $2,610 | $37,700 | $9,250 | $28,450 |
| 2018 | $2,568 | $37,700 | $9,250 | $28,450 |
| 2017 | $2,476 | $37,700 | $9,250 | $28,450 |
| 2016 | -- | $37,700 | $9,250 | $28,450 |
| 2015 | -- | $37,700 | $9,250 | $28,450 |
| 2014 | -- | $37,700 | $9,250 | $28,450 |
Source: Public Records
Map
Nearby Homes