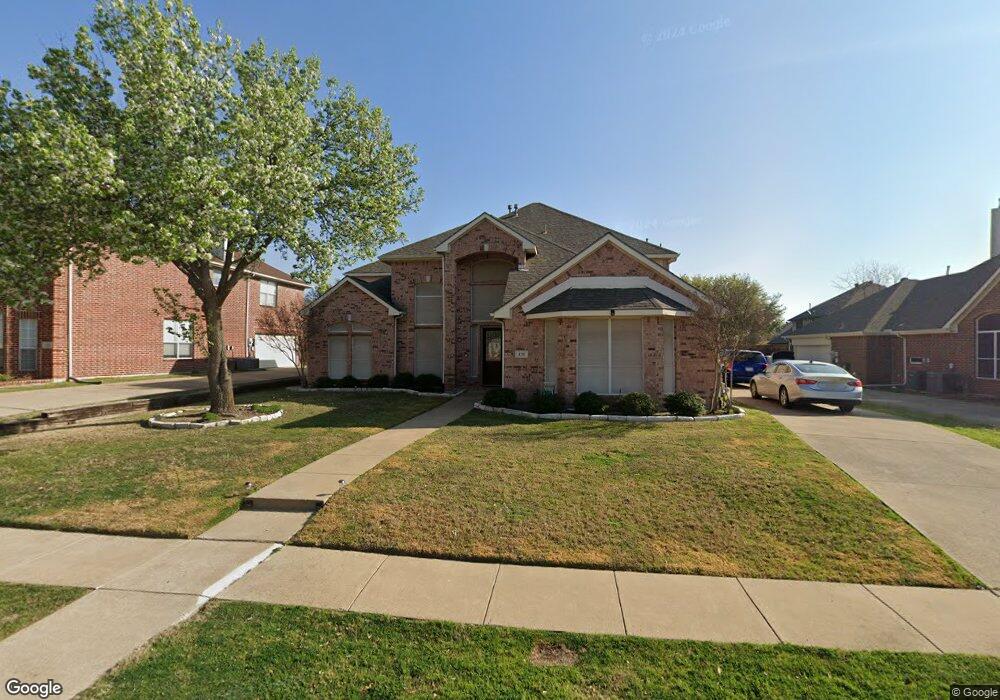
428 Sumac Ct Murphy, TX 75094
Estimated Value: $557,000 - $605,000
4
Beds
4
Baths
3,551
Sq Ft
$163/Sq Ft
Est. Value
About This Home
This home is located at 428 Sumac Ct, Murphy, TX 75094 and is currently estimated at $578,914, approximately $163 per square foot. 428 Sumac Ct is a home located in Collin County with nearby schools including Miller Elementary School, Murphy Middle School, and C A Mcmillen High School.
Ownership History
Date
Name
Owned For
Owner Type
Purchase Details
Closed on
Jan 22, 2019
Sold by
Alami Samir and Hanafi Fatima
Bought by
Shaikh Shagufta and Shaikh Mohammed
Current Estimated Value
Home Financials for this Owner
Home Financials are based on the most recent Mortgage that was taken out on this home.
Original Mortgage
$145,000
Outstanding Balance
$127,485
Interest Rate
4.6%
Mortgage Type
Purchase Money Mortgage
Estimated Equity
$451,429
Purchase Details
Closed on
Jun 25, 2015
Sold by
Alami Tamra
Bought by
Alami Samir
Home Financials for this Owner
Home Financials are based on the most recent Mortgage that was taken out on this home.
Original Mortgage
$196,000
Interest Rate
4.08%
Mortgage Type
Stand Alone First
Purchase Details
Closed on
Dec 4, 1998
Sold by
U S Home Corp
Bought by
Alami Samir and Alami Tamra
Home Financials for this Owner
Home Financials are based on the most recent Mortgage that was taken out on this home.
Original Mortgage
$145,450
Interest Rate
6.87%
Create a Home Valuation Report for This Property
The Home Valuation Report is an in-depth analysis detailing your home's value as well as a comparison with similar homes in the area
Home Values in the Area
Average Home Value in this Area
Purchase History
| Date | Buyer | Sale Price | Title Company |
|---|---|---|---|
| Shaikh Shagufta | -- | Republic Title Of Texas | |
| Alami Samir | -- | First American Title Ins Co | |
| Alami Samir | -- | -- |
Source: Public Records
Mortgage History
| Date | Status | Borrower | Loan Amount |
|---|---|---|---|
| Open | Shaikh Shagufta | $145,000 | |
| Previous Owner | Alami Samir | $196,000 | |
| Previous Owner | Alami Samir | $145,450 | |
| Closed | Alami Samir | $18,150 |
Source: Public Records
Tax History
| Year | Tax Paid | Tax Assessment Tax Assessment Total Assessment is a certain percentage of the fair market value that is determined by local assessors to be the total taxable value of land and additions on the property. | Land | Improvement |
|---|---|---|---|---|
| 2025 | $6,641 | $525,612 | $115,000 | $459,531 |
| 2024 | $6,641 | $477,829 | $115,000 | $439,773 |
| 2023 | $6,641 | $434,390 | $115,000 | $352,000 |
| 2022 | $7,734 | $394,900 | $100,000 | $365,367 |
| 2021 | $7,414 | $359,000 | $80,000 | $279,000 |
| 2020 | $7,247 | $347,000 | $70,000 | $277,000 |
| 2019 | $7,121 | $325,000 | $70,000 | $255,000 |
| 2018 | $7,726 | $349,413 | $70,000 | $286,429 |
| 2017 | $7,023 | $317,648 | $70,000 | $247,648 |
| 2016 | $6,524 | $313,764 | $60,000 | $253,764 |
| 2015 | $5,330 | $275,430 | $45,000 | $230,430 |
| 2014 | $5,330 | $240,863 | $0 | $0 |
Source: Public Records
Map
Nearby Homes
- 524 Jasmine Dr
- 202 Sweetgum Dr
- 316 Mimosa Dr
- 428 Rainforest Ct
- 300 Shady Timbers Ln
- 108 Starlite Dr
- 1008 Yarnell Place
- 5811 Abingdon Dr
- 155 Sunset Dr
- 101 Hawthorne Dr
- 465 Kinney Dr
- 5924 Mulvane Dr
- 3207 Abingdon Dr
- 110 Birch Blvd
- 3805 Wellington Dr
- 402 S Maxwell Creek Rd
- Lot 1 Maxwell Creek Rd
- LOT 2 Maxwell Creek Rd
- 505 Horizon Ct
- 600 E Fm 544
- 424 Sumac Ct
- 432 Sumac Ct
- 425 Willow Bend Dr
- 421 Willow Bend Dr
- 420 Sumac Ct
- 429 Willow Bend Dr
- 417 Willow Bend Dr
- 436 Sumac Ct
- 429 Sumac Ct
- 425 Sumac Ct
- 416 Sumac Ct
- 437 Sumac Ct
- 433 Sumac Ct
- 421 Sumac Ct
- 413 Willow Bend Dr
- 215 Briar Oak Dr
- 416 Willow Bend Dr
- 420 Willow Bend Dr
- 412 Sumac Ct
- 219 Briar Oak Dr
Your Personal Tour Guide
Ask me questions while you tour the home.