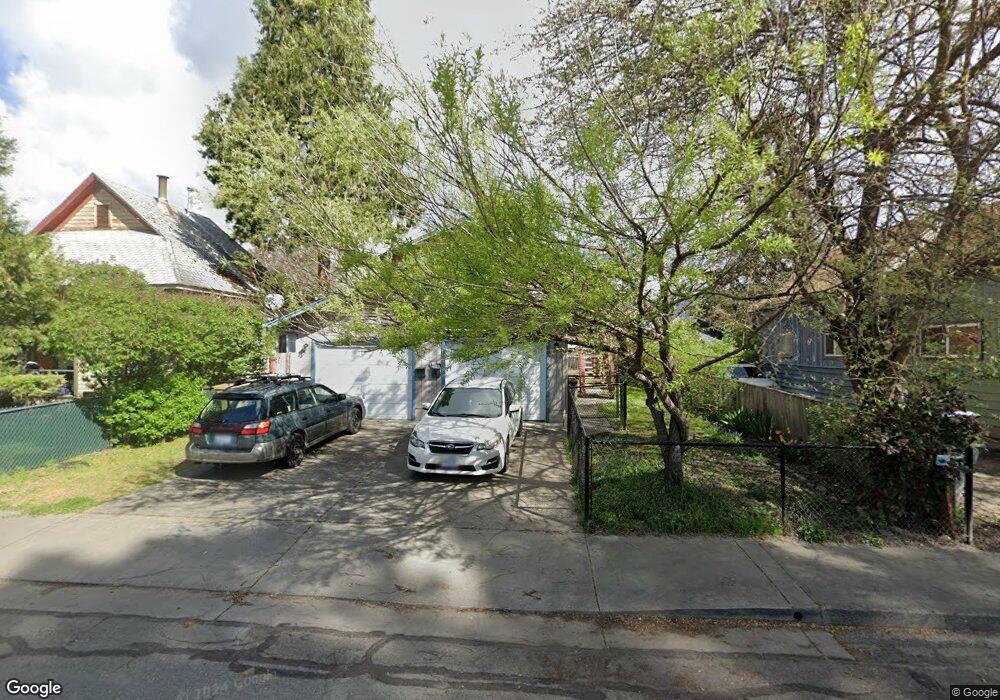
428 SW I St Grants Pass, OR 97526
Estimated Value: $401,119 - $417,000
2
Beds
2
Baths
1,824
Sq Ft
$224/Sq Ft
Est. Value
About This Home
This home is located at 428 SW I St, Grants Pass, OR 97526 and is currently estimated at $409,060, approximately $224 per square foot. 428 SW I St is a home located in Josephine County with nearby schools including Riverside Elementary School, North Middle School, and Grants Pass High School.
Ownership History
Date
Name
Owned For
Owner Type
Purchase Details
Closed on
Sep 16, 2020
Sold by
Evergreen Properties Inc
Bought by
Meyer Richard D
Current Estimated Value
Home Financials for this Owner
Home Financials are based on the most recent Mortgage that was taken out on this home.
Original Mortgage
$187,000
Outstanding Balance
$165,573
Interest Rate
2.9%
Mortgage Type
New Conventional
Estimated Equity
$243,487
Purchase Details
Closed on
Jul 5, 2017
Sold by
Holland Jerry and Holland Judy
Bought by
Evergreen Properties Inc
Home Financials for this Owner
Home Financials are based on the most recent Mortgage that was taken out on this home.
Original Mortgage
$147,700
Interest Rate
4.75%
Mortgage Type
Adjustable Rate Mortgage/ARM
Create a Home Valuation Report for This Property
The Home Valuation Report is an in-depth analysis detailing your home's value as well as a comparison with similar homes in the area
Home Values in the Area
Average Home Value in this Area
Purchase History
| Date | Buyer | Sale Price | Title Company |
|---|---|---|---|
| Meyer Richard D | $297,000 | Lawyers Title Of Oregon Llc | |
| Evergreen Properties Inc | $205,000 | Ticor Title Company Of Or |
Source: Public Records
Mortgage History
| Date | Status | Borrower | Loan Amount |
|---|---|---|---|
| Open | Meyer Richard D | $187,000 | |
| Previous Owner | Evergreen Properties Inc | $147,700 |
Source: Public Records
Tax History Compared to Growth
Tax History
| Year | Tax Paid | Tax Assessment Tax Assessment Total Assessment is a certain percentage of the fair market value that is determined by local assessors to be the total taxable value of land and additions on the property. | Land | Improvement |
|---|---|---|---|---|
| 2025 | $2,797 | $215,370 | -- | -- |
| 2024 | $2,797 | $209,100 | -- | -- |
| 2023 | $2,634 | $203,010 | $0 | $0 |
| 2022 | $2,647 | $197,100 | -- | -- |
| 2021 | $2,486 | $191,360 | $0 | $0 |
| 2020 | $2,414 | $185,790 | $0 | $0 |
| 2019 | $2,344 | $180,380 | $0 | $0 |
| 2018 | $2,386 | $175,130 | $0 | $0 |
| 2017 | $2,368 | $170,030 | $0 | $0 |
| 2016 | $2,081 | $165,080 | $0 | $0 |
| 2015 | $2,014 | $160,280 | $0 | $0 |
| 2014 | $1,958 | $155,620 | $0 | $0 |
Source: Public Records
Map
Nearby Homes