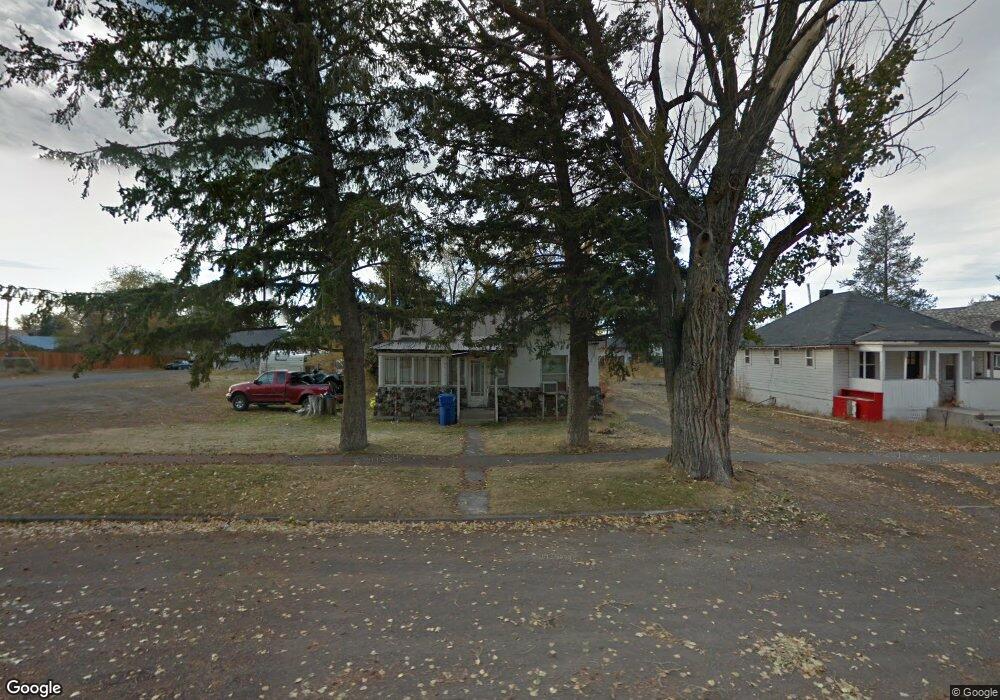
428 W 3rd N Saint Anthony, ID 83445
Estimated Value: $136,000 - $195,000
1
Bed
1
Bath
750
Sq Ft
$232/Sq Ft
Est. Value
About This Home
This home is located at 428 W 3rd N, Saint Anthony, ID 83445 and is currently estimated at $174,333, approximately $232 per square foot. 428 W 3rd N is a home located in Fremont County with nearby schools including Henrys Fork Elementary School, South Fremont Junior High School, and South Fremont High School.
Ownership History
Date
Name
Owned For
Owner Type
Purchase Details
Closed on
Aug 2, 2022
Sold by
West Cedar Holdings Llc
Bought by
Madison Square Llc
Current Estimated Value
Purchase Details
Closed on
Oct 10, 2019
Sold by
Clark Property Rentals Llc
Bought by
West Cedar Holdings Llc
Purchase Details
Closed on
Sep 26, 2016
Sold by
Pottersville Llp
Bought by
Clark Property Rentals Llc
Purchase Details
Closed on
Nov 28, 2012
Sold by
Halbert Justin and Halbert Kelsey
Bought by
Pottersville Llp
Purchase Details
Closed on
Mar 23, 2012
Sold by
Federal Home Loan Mortgage Corporation
Bought by
Halbert Justin V and Halbert Kelsey N
Purchase Details
Closed on
Nov 15, 2011
Sold by
Ball Matthew
Bought by
Federal Home Loan Mortgage Corporation
Create a Home Valuation Report for This Property
The Home Valuation Report is an in-depth analysis detailing your home's value as well as a comparison with similar homes in the area
Home Values in the Area
Average Home Value in this Area
Purchase History
| Date | Buyer | Sale Price | Title Company |
|---|---|---|---|
| Madison Square Llc | -- | Alliance Title | |
| West Cedar Holdings Llc | -- | None Available | |
| Clark Property Rentals Llc | -- | None Available | |
| Pottersville Llp | -- | None Available | |
| Halbert Justin V | -- | First American Title Co | |
| Federal Home Loan Mortgage Corporation | -- | -- |
Source: Public Records
Tax History Compared to Growth
Tax History
| Year | Tax Paid | Tax Assessment Tax Assessment Total Assessment is a certain percentage of the fair market value that is determined by local assessors to be the total taxable value of land and additions on the property. | Land | Improvement |
|---|---|---|---|---|
| 2025 | $823 | $77,543 | $16,770 | $60,773 |
| 2024 | $823 | $76,129 | $16,770 | $59,359 |
| 2023 | $738 | $62,695 | $16,770 | $45,925 |
| 2022 | $797 | $53,947 | $16,770 | $37,177 |
| 2021 | $825 | $44,556 | $13,721 | $30,835 |
| 2020 | $844 | $42,806 | $13,721 | $29,085 |
| 2019 | $840 | $42,806 | $13,721 | $29,085 |
| 2018 | $821 | $39,089 | $13,721 | $25,368 |
| 2017 | $9 | $33,647 | $13,309 | $20,338 |
| 2016 | $862 | $33,647 | $13,309 | $20,338 |
| 2015 | $852 | $33,647 | $0 | $0 |
| 2014 | $632 | $33,647 | $0 | $0 |
| 2013 | $632 | $33,668 | $0 | $0 |
Source: Public Records
Map
Nearby Homes