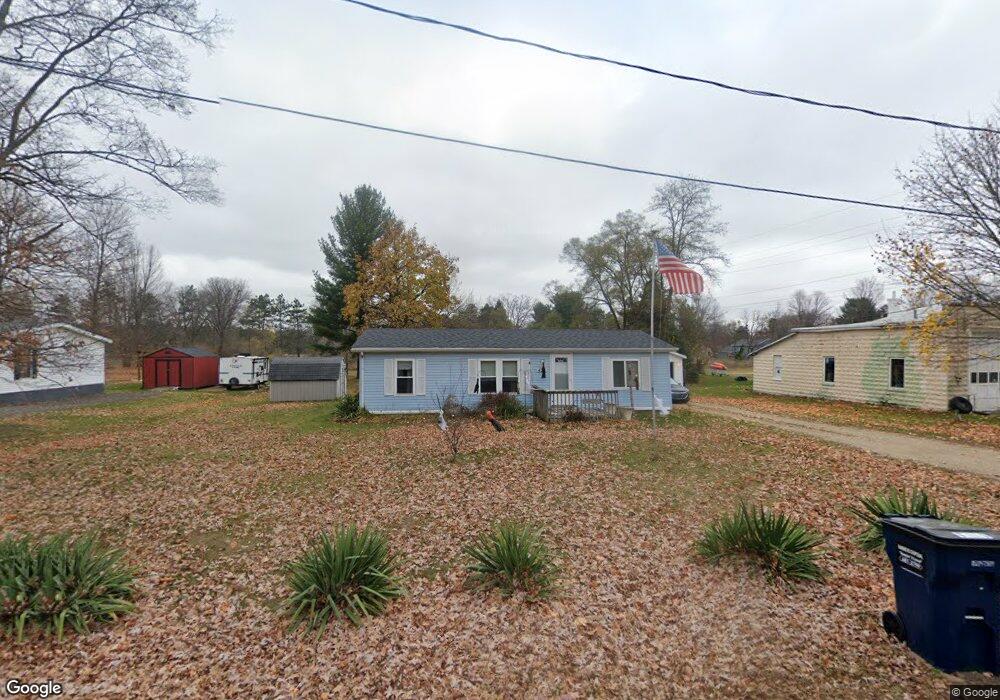
428 W Elm St Wayland, MI 49348
Estimated Value: $218,000 - $301,000
1
Bed
1
Bath
960
Sq Ft
$260/Sq Ft
Est. Value
About This Home
This home is located at 428 W Elm St, Wayland, MI 49348 and is currently estimated at $249,365, approximately $259 per square foot. 428 W Elm St is a home located in Allegan County with nearby schools including Wayland High School, St. Therese Catholic School, and St. Stanislaus School.
Ownership History
Date
Name
Owned For
Owner Type
Purchase Details
Closed on
Apr 1, 2011
Sold by
Koval Inc
Bought by
J & P Dreamers Llc
Current Estimated Value
Purchase Details
Closed on
Jan 5, 2011
Sold by
Fifth Third Bank Western Michigan
Bought by
Koval Inc
Purchase Details
Closed on
Aug 5, 2010
Sold by
Woods Autumn and Woods Nicholas
Bought by
Fifth Third Bank Western Michigan
Purchase Details
Closed on
Jul 29, 2004
Sold by
Frank Ronald E and Frank Evelyn R
Bought by
Woods Nicholas J and Woods Autumn
Purchase Details
Closed on
Nov 10, 1997
Sold by
Franck Eli A and Franck Jeannie L
Bought by
Frank Ronald E and Frank Evelyn R
Create a Home Valuation Report for This Property
The Home Valuation Report is an in-depth analysis detailing your home's value as well as a comparison with similar homes in the area
Home Values in the Area
Average Home Value in this Area
Purchase History
| Date | Buyer | Sale Price | Title Company |
|---|---|---|---|
| J & P Dreamers Llc | -- | None Available | |
| Koval Inc | $24,500 | Fidelity Land Title Agency | |
| Fifth Third Bank Western Michigan | $15,000 | None Available | |
| Woods Nicholas J | $65,000 | -- | |
| Frank Ronald E | -- | -- |
Source: Public Records
Tax History Compared to Growth
Tax History
| Year | Tax Paid | Tax Assessment Tax Assessment Total Assessment is a certain percentage of the fair market value that is determined by local assessors to be the total taxable value of land and additions on the property. | Land | Improvement |
|---|---|---|---|---|
| 2025 | $2,992 | $92,000 | $20,700 | $71,300 |
| 2024 | $2,718 | $82,200 | $16,700 | $65,500 |
| 2023 | $2,718 | $66,500 | $16,400 | $50,100 |
| 2022 | $2,718 | $59,800 | $15,200 | $44,600 |
| 2021 | $2,558 | $55,900 | $15,200 | $40,700 |
| 2020 | $2,558 | $53,500 | $15,200 | $38,300 |
| 2019 | $2,445 | $51,600 | $14,600 | $37,000 |
| 2018 | $0 | $49,000 | $14,600 | $34,400 |
| 2017 | $0 | $49,600 | $14,600 | $35,000 |
| 2016 | $0 | $41,300 | $12,700 | $28,600 |
| 2015 | -- | $41,300 | $12,700 | $28,600 |
| 2014 | -- | $39,400 | $14,600 | $24,800 |
| 2013 | -- | $36,700 | $14,600 | $22,100 |
Source: Public Records
Map
Nearby Homes
- 545 N Main St
- 219 Alpine St
- 3570 Windsor Woods Dr
- 110 E Sycamore St
- 1162 Saskatoon Trail
- 3770 Division Ave S
- 620 S Main St
- 4674 12th St
- 342 Lotz Ct
- 816 Geneva Dr
- 3405 13th St
- 3296 Stonehill Ct
- 3905 Sunset View
- 3669 Kalamazoo Dr
- 986 129th Ave
- 1376 142nd Ave
- Freedom Plan at Harvest Meadows
- Sierra Plan at Harvest Meadows
- Vienna Plan at Harvest Meadows
- London Plan at Harvest Meadows