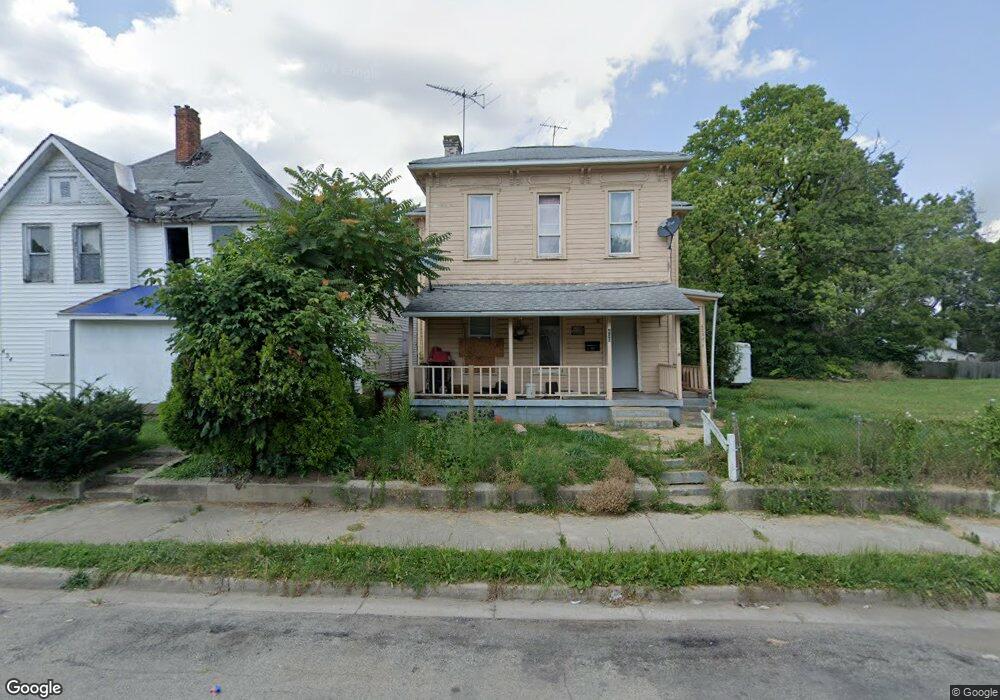
428 W Mulberry St Unit 430 Springfield, OH 45506
Estimated Value: $56,514 - $88,000
5
Beds
2
Baths
2,278
Sq Ft
$33/Sq Ft
Est. Value
About This Home
This home is located at 428 W Mulberry St Unit 430, Springfield, OH 45506 and is currently estimated at $75,379, approximately $33 per square foot. 428 W Mulberry St Unit 430 is a home located in Clark County with nearby schools including Fulton Elementary School, Hayward Middle School, and Springfield High School.
Ownership History
Date
Name
Owned For
Owner Type
Purchase Details
Closed on
May 12, 2023
Sold by
Merchants National Bank
Bought by
Equity Trust Co and Morefield Ira Michele M
Current Estimated Value
Purchase Details
Closed on
Jan 23, 2023
Sold by
Sheriff Of Clark County
Bought by
Merchants National Bank
Purchase Details
Closed on
May 15, 2019
Sold by
Younce Scott H
Bought by
Crowder Anthony
Purchase Details
Closed on
Oct 17, 2015
Sold by
Johnson Tom
Bought by
Younce Scott H and Younce Scott
Home Financials for this Owner
Home Financials are based on the most recent Mortgage that was taken out on this home.
Original Mortgage
$32,892
Interest Rate
3.93%
Mortgage Type
Commercial
Purchase Details
Closed on
Apr 12, 2013
Sold by
Johnson Tom
Bought by
Younce Scott H and Younce Scott
Purchase Details
Closed on
Sep 14, 2012
Sold by
Harbour Portfolio Vi Lp
Bought by
Younce Scott
Purchase Details
Closed on
Sep 30, 2010
Sold by
Fannie Mae
Bought by
Harbour Portfolio Vi Lp
Purchase Details
Closed on
Dec 18, 2009
Sold by
Hatfield Donald D
Bought by
Federal National Mortgage Association
Create a Home Valuation Report for This Property
The Home Valuation Report is an in-depth analysis detailing your home's value as well as a comparison with similar homes in the area
Home Values in the Area
Average Home Value in this Area
Purchase History
| Date | Buyer | Sale Price | Title Company |
|---|---|---|---|
| Equity Trust Co | $8,500 | City Title | |
| Equity Trust | $8,500 | City Title | |
| Merchants National Bank | $23,334 | -- | |
| Merchants National Bank | $23,334 | None Listed On Document | |
| Crowder Anthony | $25,000 | None Available | |
| Younce Scott H | -- | City Title Agency | |
| Younce Scott H | $2,000 | None Available | |
| Younce Scott H | $2,000 | None Available | |
| Younce Scott | $625,000 | -- | |
| Harbour Portfolio Vi Lp | $3,100 | Attorney | |
| Federal National Mortgage Association | $13,400 | None Available |
Source: Public Records
Mortgage History
| Date | Status | Borrower | Loan Amount |
|---|---|---|---|
| Previous Owner | Younce Scott H | $32,892 |
Source: Public Records
Tax History
| Year | Tax Paid | Tax Assessment Tax Assessment Total Assessment is a certain percentage of the fair market value that is determined by local assessors to be the total taxable value of land and additions on the property. | Land | Improvement |
|---|---|---|---|---|
| 2025 | $902 | $18,030 | $1,300 | $16,730 |
| 2024 | $632 | $8,260 | $970 | $7,290 |
| 2023 | $408 | $8,260 | $970 | $7,290 |
| 2022 | $2,494 | $8,260 | $970 | $7,290 |
| 2021 | $435 | $7,910 | $930 | $6,980 |
| 2020 | $436 | $7,910 | $930 | $6,980 |
| 2019 | $437 | $7,910 | $930 | $6,980 |
| 2018 | $407 | $7,070 | $930 | $6,140 |
| 2017 | $406 | $7,071 | $928 | $6,143 |
| 2016 | $407 | $7,071 | $928 | $6,143 |
| 2015 | $404 | $6,885 | $928 | $5,957 |
| 2014 | $403 | $6,885 | $928 | $5,957 |
| 2013 | $398 | $6,885 | $928 | $5,957 |
Source: Public Records
Map
Nearby Homes
- 302 W Pleasant St
- 525 S Light St
- 702 S Wittenberg Ave
- 410 W Liberty St
- 209 W Liberty St
- 727 W High St
- 0 Lower Valley Pike Unit 947313
- 38 W High St Unit 3B
- 642 W Euclid Ave
- 830 Dibert Ave
- 411 S Limestone St
- 311 W Grand Ave
- 3 Mill Run Place
- 9 Mill Run Place
- 506 W Southern Ave
- 802 Innisfallen Ave
- 405 W Southern Ave
- 409 W Southern Ave
- 907-913 S Limestone St
- 222 N Race St Unit 224
- 432 W Mulberry St Unit 434
- 322 Franklin St
- 416 W Mulberry St
- 320 Franklin St
- 502 W Mulberry St
- 414 W Mulberry St
- 435 W Mulberry St
- 427 W Mulberry St
- 429 W Mulberry St
- 508 W Mulberry St
- 314 Franklin St
- 433 W Mulberry St
- 419 W Mulberry St Unit 421
- 327 Franklin St
- 501 W Mulberry St
- 329 S Plum St
- 415 W Mulberry St
- 512 W Mulberry St
- 312 Franklin St Unit 312
- 317 Franklin St