Estimated Value: $156,109 - $210,000
--
Bed
2
Baths
1,075
Sq Ft
$172/Sq Ft
Est. Value
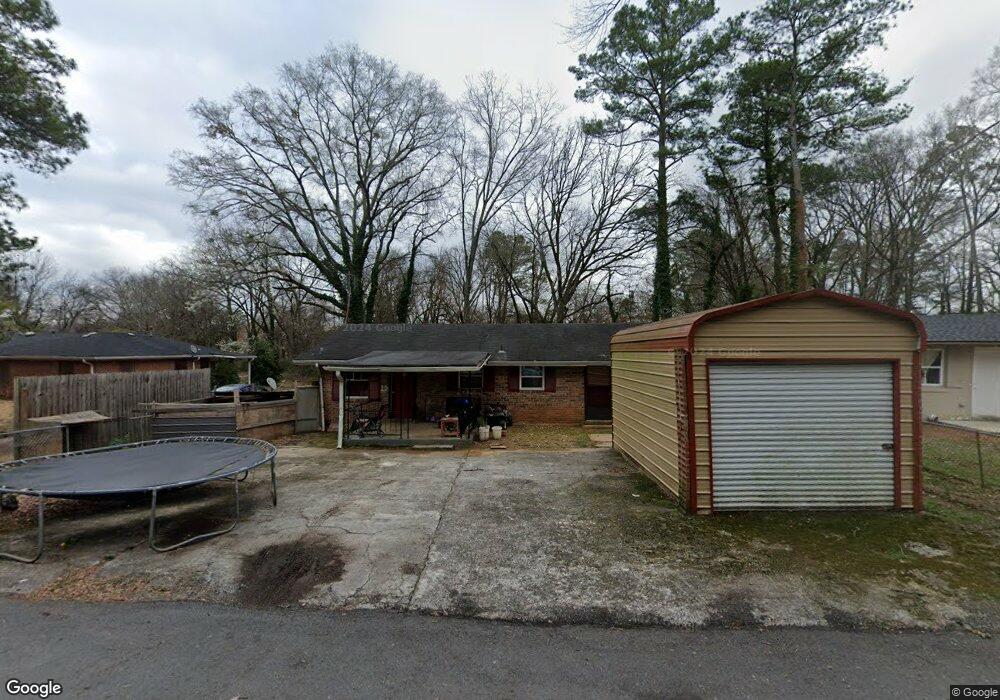
About This Home
This home is located at 428 Walter St NW, Rome, GA 30165 and is currently estimated at $184,527, approximately $171 per square foot. 428 Walter St NW is a home located in Floyd County with nearby schools including Rome High School and St. Mary School.
Ownership History
Date
Name
Owned For
Owner Type
Purchase Details
Closed on
Jun 8, 2018
Sold by
Jones Sherrie Dianne
Bought by
Romeo Velasquez Floricelda and Romeo Vicente
Current Estimated Value
Purchase Details
Closed on
Jan 18, 1994
Bought by
P and R
Purchase Details
Closed on
Feb 4, 1987
Sold by
Jones Sherrie and John Edward
Bought by
Jones Sherry
Purchase Details
Closed on
Jul 8, 1982
Sold by
Erwin Sherrie Dianne
Bought by
Jones Sherrie and John Edward
Purchase Details
Closed on
Jun 15, 1982
Sold by
Sanchez Rena Cooper and Erwin Sherrie Dian
Bought by
Erwin Sherrie Dianne
Purchase Details
Closed on
May 26, 1982
Sold by
Sanchez Rena Cooper and Sanchez John S
Bought by
Sanchez Rean Cooper and Pine Log Land
Purchase Details
Closed on
May 14, 1982
Sold by
Chambers Freddie T and Ollie Marie G
Bought by
Sanchez Rena Cooper and Sanchez John S
Purchase Details
Closed on
Feb 18, 1982
Sold by
Cooper John 1\3 7 Doris 1\3 & Rena Coope
Bought by
Chambers Freddie T and Ollie Marie G
Purchase Details
Closed on
Dec 10, 1968
Bought by
Cooper John 1\3 7 Doris 1\3 & Rena Coope
Create a Home Valuation Report for This Property
The Home Valuation Report is an in-depth analysis detailing your home's value as well as a comparison with similar homes in the area
Home Values in the Area
Average Home Value in this Area
Purchase History
| Date | Buyer | Sale Price | Title Company |
|---|---|---|---|
| Romeo Velasquez Floricelda | $27,000 | -- | |
| P | -- | -- | |
| Jones Sherry | -- | -- | |
| Jones Sherrie | $13,900 | -- | |
| Erwin Sherrie Dianne | $13,800 | -- | |
| Sanchez Rena Cooper | $7,500 | -- | |
| Sanchez Rean Cooper | $27,000 | -- | |
| Sanchez Rena Cooper | $29,500 | -- | |
| Chambers Freddie T | -- | -- | |
| Cooper John 1\3 7 Doris 1\3 & Rena Coope | -- | -- |
Source: Public Records
Tax History Compared to Growth
Tax History
| Year | Tax Paid | Tax Assessment Tax Assessment Total Assessment is a certain percentage of the fair market value that is determined by local assessors to be the total taxable value of land and additions on the property. | Land | Improvement |
|---|---|---|---|---|
| 2024 | $2,291 | $58,608 | $7,434 | $51,174 |
| 2023 | $2,076 | $55,547 | $6,758 | $48,789 |
| 2022 | $1,638 | $44,887 | $5,407 | $39,480 |
| 2021 | $1,378 | $37,141 | $5,407 | $31,734 |
| 2020 | $1,269 | $33,925 | $4,224 | $29,701 |
| 2019 | $416 | $32,425 | $4,224 | $28,201 |
| 2018 | $1,084 | $30,557 | $4,224 | $26,333 |
| 2017 | $1,055 | $29,778 | $4,224 | $25,554 |
| 2016 | $1,044 | $29,409 | $4,200 | $25,209 |
| 2015 | $658 | $29,409 | $4,200 | $25,209 |
| 2014 | $658 | $29,409 | $4,200 | $25,209 |
Source: Public Records
Map
Nearby Homes
- 124 Sheridan Dr NW
- 808 Charlton St NW
- 23 Sweetspire Dr NW
- 21 Sweetspire Dr NW
- 614 Briarwood Cir NW
- 8 S Hughes St SW
- 14 Vineland Dr NW
- 17 Rosewood Rd SW
- 209 Sherwood Rd SW
- 8 Leon St SW
- 4 Homestead Cir NW
- 3 Berckman Ln SW
- 100 Dellwood Dr NW
- 19 Berckman Ln SW
- 14 Berckman Ln SW
- 9 Shorter Cir SW
- 204 Oakwood St NW
- 0 Mount Alto Rd SW Unit 10523740
- 13 Ridgewood Rd SW
- 422 Walter St NW
- 433 Walter St NW
- 423 Walter St NW
- 515 N Division St NW
- 421 Walter St NW
- 418 Walter St NW
- 513 N Division St NW
- 513 N Division St NW
- 513 N Division St NW
- 517 N Division St NW
- 0 Fortune St Unit 20094463
- 0 Fortune St
- 519 N Division St NW
- 104 Fortune St NW
- 505 N Division St NW
- 106 Fortune St NW
- 0 Walter St Unit 20094477
- 0 Walter St Unit 8505627
- 0 Walter St Unit 8165439
- 0 Walter St Unit 8799581