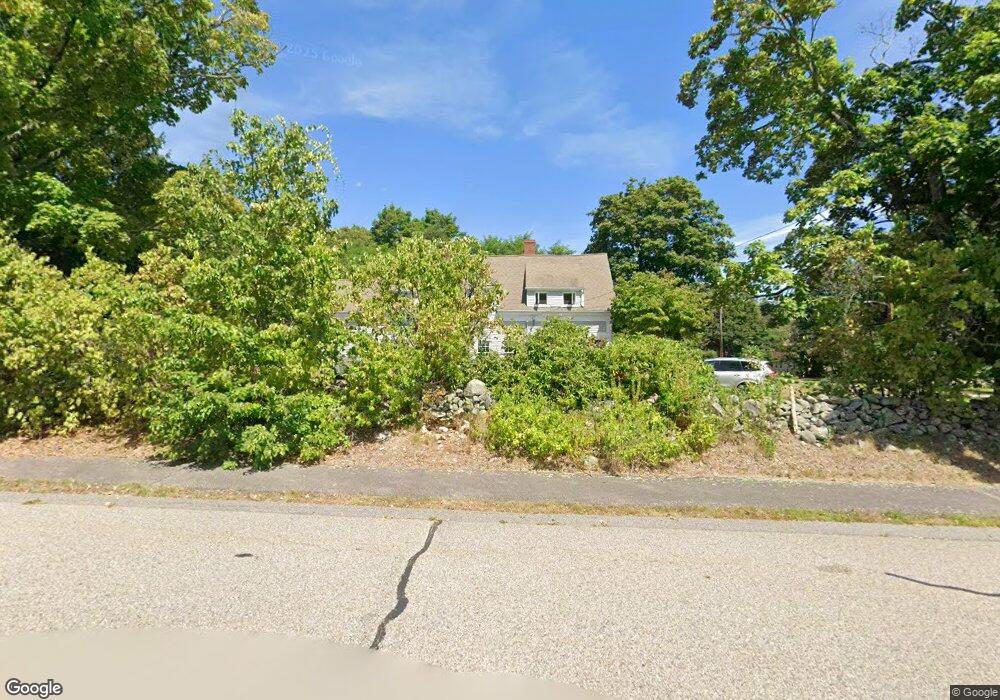
428 West St Wrentham, MA 02093
Sheldonville NeighborhoodEstimated Value: $627,000 - $641,000
4
Beds
1
Bath
1,764
Sq Ft
$361/Sq Ft
Est. Value
About This Home
This home is located at 428 West St, Wrentham, MA 02093 and is currently estimated at $636,303, approximately $360 per square foot. 428 West St is a home located in Norfolk County with nearby schools including Delaney Elementary School, Charles E Roderick, and Mercymount Country Day School.
Ownership History
Date
Name
Owned For
Owner Type
Purchase Details
Closed on
Aug 7, 2002
Sold by
Flannery Joan
Bought by
Flannery Paul C
Current Estimated Value
Home Financials for this Owner
Home Financials are based on the most recent Mortgage that was taken out on this home.
Original Mortgage
$200,000
Outstanding Balance
$84,811
Interest Rate
6.58%
Mortgage Type
Purchase Money Mortgage
Estimated Equity
$551,492
Create a Home Valuation Report for This Property
The Home Valuation Report is an in-depth analysis detailing your home's value as well as a comparison with similar homes in the area
Home Values in the Area
Average Home Value in this Area
Purchase History
| Date | Buyer | Sale Price | Title Company |
|---|---|---|---|
| Flannery Paul C | $300,000 | -- |
Source: Public Records
Mortgage History
| Date | Status | Borrower | Loan Amount |
|---|---|---|---|
| Open | Flannery Paul C | $200,000 |
Source: Public Records
Tax History Compared to Growth
Tax History
| Year | Tax Paid | Tax Assessment Tax Assessment Total Assessment is a certain percentage of the fair market value that is determined by local assessors to be the total taxable value of land and additions on the property. | Land | Improvement |
|---|---|---|---|---|
| 2025 | $6,407 | $552,800 | $288,100 | $264,700 |
| 2024 | $6,229 | $519,100 | $288,100 | $231,000 |
| 2023 | $6,167 | $488,700 | $262,000 | $226,700 |
| 2022 | $6,069 | $444,000 | $255,200 | $188,800 |
| 2021 | $5,976 | $424,700 | $238,500 | $186,200 |
| 2020 | $5,342 | $374,900 | $182,100 | $192,800 |
| 2019 | $4,958 | $351,100 | $163,900 | $187,200 |
| 2018 | $4,235 | $297,400 | $163,700 | $133,700 |
| 2017 | $4,056 | $284,600 | $160,500 | $124,100 |
| 2016 | $3,944 | $276,200 | $155,900 | $120,300 |
| 2015 | $4,121 | $275,100 | $166,500 | $108,600 |
| 2014 | $4,080 | $266,500 | $160,100 | $106,400 |
Source: Public Records
Map
Nearby Homes
- 50 Green St
- 80 Carriage House Ln
- 440 Chestnut St
- 1204 South St
- 1222 South St
- 791 South St Unit 5
- 955 Summer St
- 19 Chestnut Lot 0
- 4 Munroe Dr
- 11 Amber Dr
- Lot 1 - Blueberry 2 Car Plan at King Philip Estates
- Lot 8 - Blueberry 2 Car Plan at King Philip Estates
- Lot 5 - Hughes 2 car Plan at King Philip Estates
- Lot 6 - Blueberry 3 Car Plan at King Philip Estates
- Lot 2 - Camden 2 Car Plan at King Philip Estates
- Lot 7 - Cedar Plan at King Philip Estates
- Lot 4 - Hemingway 2 Car Plan at King Philip Estates
- Lot 3 - Blueberry 2 Car Plan at King Philip Estates
- Lot 3 - 14 Earle Stewart Ln
- 12 Grant St