428 Wingate Place S Mount Sterling, OH 43143
Estimated Value: $303,194 - $357,000
3
Beds
3
Baths
2,148
Sq Ft
$155/Sq Ft
Est. Value
About This Home
This home is located at 428 Wingate Place S, Mount Sterling, OH 43143 and is currently estimated at $332,049, approximately $154 per square foot. 428 Wingate Place S is a home with nearby schools including Madison-Plains Elementary School, Madison-Plains Intermediate School, and Madison-Plains Junior High School.
Ownership History
Date
Name
Owned For
Owner Type
Purchase Details
Closed on
Jun 24, 2019
Sold by
Schiering Wendy F and Fish Robert
Bought by
Fish Wendy
Current Estimated Value
Home Financials for this Owner
Home Financials are based on the most recent Mortgage that was taken out on this home.
Original Mortgage
$154,200
Outstanding Balance
$135,305
Interest Rate
4%
Mortgage Type
New Conventional
Estimated Equity
$196,744
Purchase Details
Closed on
Sep 21, 2011
Sold by
Schiering John M
Bought by
Schiering Wendy F
Purchase Details
Closed on
Aug 14, 2008
Sold by
Maronda Homes Inc
Bought by
Schiering John M
Home Financials for this Owner
Home Financials are based on the most recent Mortgage that was taken out on this home.
Original Mortgage
$158,113
Interest Rate
6.42%
Mortgage Type
FHA
Purchase Details
Closed on
Jan 18, 2007
Sold by
Deer Creek Run Llc
Bought by
Maronda Homes Inc Of Ohio
Create a Home Valuation Report for This Property
The Home Valuation Report is an in-depth analysis detailing your home's value as well as a comparison with similar homes in the area
Home Values in the Area
Average Home Value in this Area
Purchase History
| Date | Buyer | Sale Price | Title Company |
|---|---|---|---|
| Fish Wendy | -- | Servicelink | |
| Schiering Wendy F | -- | Attorney | |
| Schiering John M | $161,700 | Stewart Title | |
| Maronda Homes Inc Of Ohio | $1,770,000 | None Available |
Source: Public Records
Mortgage History
| Date | Status | Borrower | Loan Amount |
|---|---|---|---|
| Open | Fish Wendy | $154,200 | |
| Previous Owner | Schiering John M | $158,113 |
Source: Public Records
Tax History Compared to Growth
Tax History
| Year | Tax Paid | Tax Assessment Tax Assessment Total Assessment is a certain percentage of the fair market value that is determined by local assessors to be the total taxable value of land and additions on the property. | Land | Improvement |
|---|---|---|---|---|
| 2024 | $2,617 | $74,750 | $12,870 | $61,880 |
| 2023 | $2,617 | $74,750 | $12,870 | $61,880 |
| 2022 | $2,284 | $61,660 | $10,610 | $51,050 |
| 2021 | $2,226 | $61,660 | $10,610 | $51,050 |
| 2020 | $2,229 | $61,660 | $10,610 | $51,050 |
| 2019 | $1,844 | $52,520 | $9,650 | $42,870 |
| 2018 | $1,808 | $52,520 | $9,650 | $42,870 |
| 2017 | $2,022 | $52,520 | $9,650 | $42,870 |
| 2016 | $2,022 | $61,090 | $9,650 | $51,440 |
| 2015 | $1,983 | $61,090 | $9,650 | $51,440 |
| 2014 | $1,983 | $61,090 | $9,650 | $51,440 |
| 2013 | -- | $50,140 | $10,080 | $40,060 |
Source: Public Records
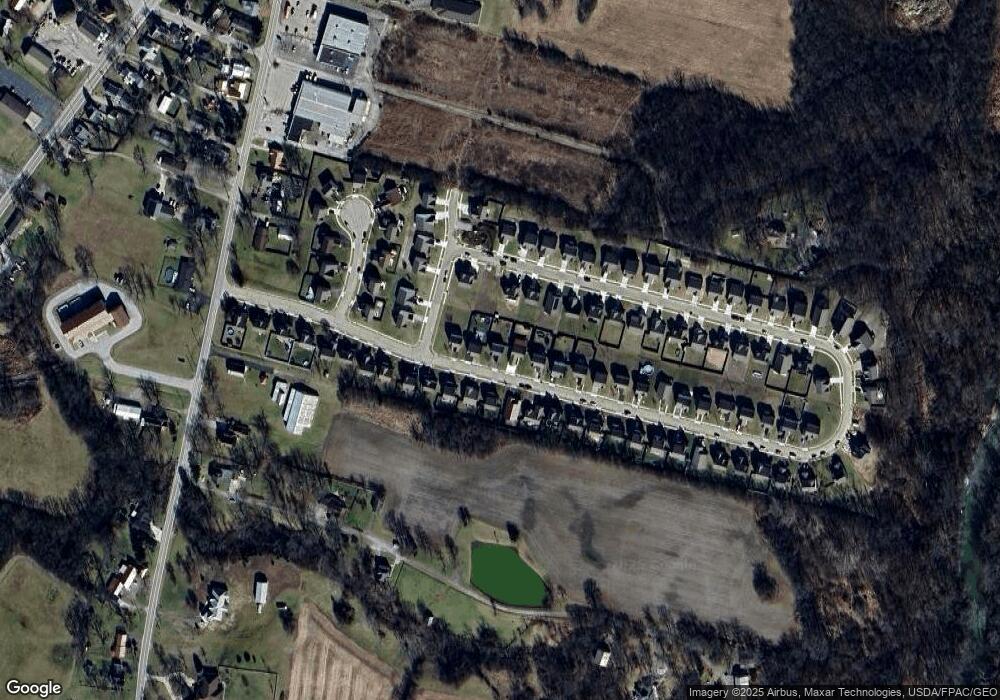
Map
Nearby Homes
- 500 Wingate Place N
- 230 W Columbus St
- 233 W Main St
- 223 W Main St
- 16185 State Route 207
- 67 W Columbus St
- 60 N London St
- 94 Jefferson St
- 178 Poplar St
- 15561 Blain Rd
- 8713 State Route 207
- 16270 Cook Yankeetown Rd NE
- 12265 Woods Opossum Run
- 10586 Baldwin Rd
- 0 Renick Rd
- 0 Rockwell Rd Unit 225016734
- 14008 1st St
- 13810 Yankeetown Chenoweth Rd
- 12343 State Route 316
- 10187 Mantle Rd
- 424 Wingate Place
- 432 Wingate Place
- 436 Wingate Place S
- 420 Wingate Place
- 420 Wingate Place Unit 47
- 423 Wingate Place
- 427 Wingate Place S
- 552 Wingate Place N
- 421 Wingate Place
- 431 Wingate Place Unit 14
- 431 Wingate Place
- 440 Wingate Place
- 544 Wingate Place N
- 419 Wingate Place Unit 10
- 419 Wingate Place
- 560 Wingate Place N
- 435 Wingate Place
- 540 Wingate Place N
- 444 Wingate Place S
- 439 Wingate Place S