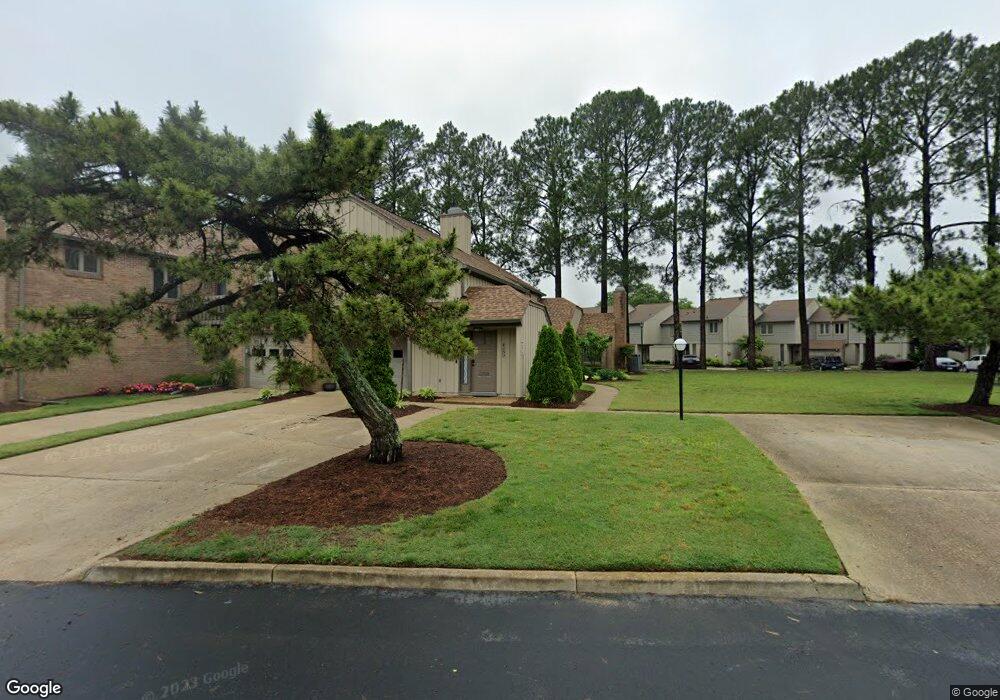
4280 Hatton Point Rd Unit 20 Portsmouth, VA 23703
Churchland NeighborhoodEstimated Value: $312,611 - $368,000
3
Beds
2
Baths
1,838
Sq Ft
$185/Sq Ft
Est. Value
About This Home
This home is located at 4280 Hatton Point Rd Unit 20, Portsmouth, VA 23703 and is currently estimated at $340,403, approximately $185 per square foot. 4280 Hatton Point Rd Unit 20 is a home located in Portsmouth City with nearby schools including Churchland Elementary School, Churchland Academy Elementary School, and Churchland Middle School.
Ownership History
Date
Name
Owned For
Owner Type
Purchase Details
Closed on
Jun 25, 2020
Sold by
Noell William C and Noelll Judith T
Bought by
Gause Aaron D
Current Estimated Value
Home Financials for this Owner
Home Financials are based on the most recent Mortgage that was taken out on this home.
Original Mortgage
$236,312
Outstanding Balance
$208,609
Interest Rate
3.1%
Mortgage Type
VA
Estimated Equity
$131,794
Purchase Details
Closed on
Jan 20, 2016
Sold by
Noell William C and Noell Judith T
Bought by
The William C Noell Iii Revocable Trust and The Judith T Noell Revocable Trust Dated
Purchase Details
Closed on
Jun 3, 2015
Sold by
Martinez Lois M
Bought by
Noell William C
Home Financials for this Owner
Home Financials are based on the most recent Mortgage that was taken out on this home.
Original Mortgage
$128,000
Interest Rate
3.62%
Mortgage Type
New Conventional
Create a Home Valuation Report for This Property
The Home Valuation Report is an in-depth analysis detailing your home's value as well as a comparison with similar homes in the area
Home Values in the Area
Average Home Value in this Area
Purchase History
| Date | Buyer | Sale Price | Title Company |
|---|---|---|---|
| Gause Aaron D | $229,000 | Attorney | |
| The William C Noell Iii Revocable Trust | -- | None Available | |
| Noell William C | $160,000 | -- |
Source: Public Records
Mortgage History
| Date | Status | Borrower | Loan Amount |
|---|---|---|---|
| Open | Gause Aaron D | $236,312 | |
| Previous Owner | Noell William C | $128,000 |
Source: Public Records
Tax History Compared to Growth
Tax History
| Year | Tax Paid | Tax Assessment Tax Assessment Total Assessment is a certain percentage of the fair market value that is determined by local assessors to be the total taxable value of land and additions on the property. | Land | Improvement |
|---|---|---|---|---|
| 2025 | $3,264 | $259,830 | $50,000 | $209,830 |
| 2024 | $3,264 | $251,500 | $50,000 | $201,500 |
| 2023 | $3,123 | $249,840 | $50,000 | $199,840 |
| 2022 | $2,909 | $223,790 | $40,000 | $183,790 |
| 2021 | $2,598 | $199,820 | $40,000 | $159,820 |
| 2020 | $2,598 | $199,820 | $40,000 | $159,820 |
| 2019 | $2,598 | $199,820 | $40,000 | $159,820 |
| 2018 | $2,360 | $181,570 | $45,740 | $135,830 |
| 2017 | $2,272 | $174,770 | $45,740 | $129,030 |
| 2016 | $2,272 | $174,770 | $45,740 | $129,030 |
| 2015 | $2,331 | $179,330 | $45,740 | $133,590 |
| 2014 | $2,362 | $186,010 | $45,740 | $140,270 |
Source: Public Records
Map
Nearby Homes
- 4286 Hatton Point Ln
- 4291 Hatton Point Ln
- 4285 Hatton Point Ln
- 4257 Hatton Point Ln Unit 44
- 4239 Hatton Point Ln Unit 35
- 3141 Riveredge Dr
- 3121 Riveredge Dr
- 4412 Carlton Ct
- 6 Waterview Ct
- 3108 Whaley Rd
- 2004 Sawgrass Ln
- 107 Lynn Dr
- 3812 Falling River Reach Unit C
- 1068 Estates Ct
- 3609 Loon Ct
- 122 Keeper St Unit 86
- 3832 New River Reach Unit A
- 4517 Wake Forest Rd
- 109 Faro Ln
- 137 Lighthouse Dr
- 4280 Hatton Point Rd
- 4280 Hatton Point Rd Unit 25
- 4278 Hatton Point Ln
- 4278 Hatton Point Ln Unit 26
- 4278 Hatton Point Rd
- 4284 Hatton Point Rd
- 4284 Hatton Point Rd Unit 23
- 4282 Hatton Point Rd
- 4282 Hatton Point Rd Unit 24
- 4378 Point West Dr
- 4376 Point West Dr
- 4372 Point West Dr
- 4370 Point West Dr
- 4374 Point Dr W
- 4374 Point West Dr
- 4380 Point West Dr
- 4368 Point West Dr
- 4368 Point Dr W
- 4372 Point Dr W
- 4296 Hatton Point Rd