Estimated Value: $470,000 - $512,000
3
Beds
2
Baths
2,322
Sq Ft
$210/Sq Ft
Est. Value
About This Home
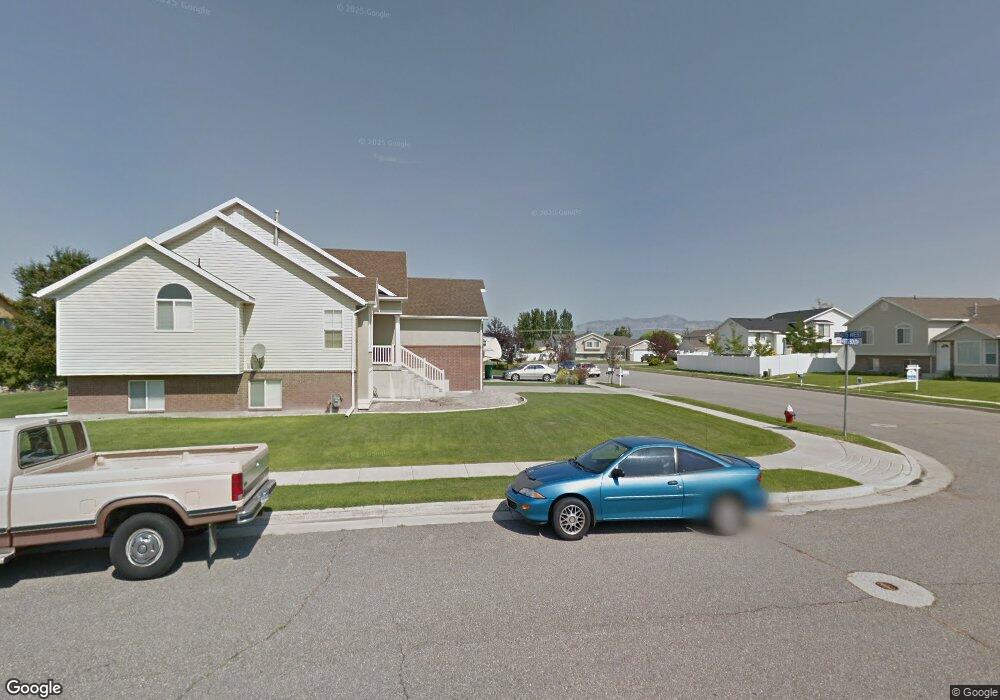
This home is located at 4282 W 4875 S, Roy, UT 84067 and is currently estimated at $487,715, approximately $210 per square foot. 4282 W 4875 S is a home located in Weber County with nearby schools including Country View School, Rocky Mountain Junior High School, and Bridge Elementary School.
Ownership History
Date
Name
Owned For
Owner Type
Purchase Details
Closed on
Mar 19, 2009
Sold by
Anderson Gary R and Anderson Eileen M
Bought by
Anderson Gary R and Anderson Eileen M
Current Estimated Value
Home Financials for this Owner
Home Financials are based on the most recent Mortgage that was taken out on this home.
Original Mortgage
$13,000
Interest Rate
5.19%
Mortgage Type
Stand Alone Second
Purchase Details
Closed on
Nov 7, 2006
Sold by
Talbot Janet M
Bought by
Anderson Gary R and Anderson Eileen M
Purchase Details
Closed on
Jul 21, 2000
Sold by
Wind River Homes Inc
Bought by
Talbot Janet M
Home Financials for this Owner
Home Financials are based on the most recent Mortgage that was taken out on this home.
Original Mortgage
$146,800
Interest Rate
8.37%
Create a Home Valuation Report for This Property
The Home Valuation Report is an in-depth analysis detailing your home's value as well as a comparison with similar homes in the area
Home Values in the Area
Average Home Value in this Area
Purchase History
| Date | Buyer | Sale Price | Title Company |
|---|---|---|---|
| Anderson Gary R | -- | Security Title Of Davis Cnty | |
| Anderson Gary R | -- | Lincoln Title Insurance Agen | |
| Talbot Janet M | -- | Backman Stewart Title |
Source: Public Records
Mortgage History
| Date | Status | Borrower | Loan Amount |
|---|---|---|---|
| Closed | Anderson Gary R | $13,000 | |
| Open | Anderson Gary R | $192,000 | |
| Previous Owner | Talbot Janet M | $146,800 |
Source: Public Records
Tax History
| Year | Tax Paid | Tax Assessment Tax Assessment Total Assessment is a certain percentage of the fair market value that is determined by local assessors to be the total taxable value of land and additions on the property. | Land | Improvement |
|---|---|---|---|---|
| 2025 | $3,134 | $506,089 | $133,433 | $372,656 |
| 2024 | $3,056 | $273,349 | $73,388 | $199,961 |
| 2023 | $2,947 | $264,000 | $67,930 | $196,070 |
| 2022 | $3,063 | $282,700 | $60,541 | $222,159 |
| 2021 | $2,391 | $361,000 | $83,732 | $277,268 |
| 2020 | $2,304 | $320,000 | $83,732 | $236,268 |
| 2019 | $2,386 | $314,000 | $47,990 | $266,010 |
| 2018 | $2,225 | $275,000 | $44,037 | $230,963 |
| 2017 | $2,012 | $232,000 | $44,037 | $187,963 |
| 2016 | $1,851 | $114,210 | $23,090 | $91,120 |
| 2015 | $1,717 | $108,376 | $23,090 | $85,286 |
| 2014 | $1,733 | $108,376 | $20,323 | $88,053 |
Source: Public Records
Map
Nearby Homes
- 4853 S 4275 W Unit 27
- 5035 S 4275 W
- 4218 W 5050 S
- 4088 W 5050 S
- 4101 W 4600 S
- 4024 W 4650 S
- 4216 W 5250 S
- 4096 W 5075 S
- 4486 S 4300 W
- 4277 W 5250 S
- 4602 S 4000 W
- 3937 W 4650 S
- 4950 3900 West St
- 4813 S 3850 W
- 4239 W 5325 S
- 4931 S 4700 W
- 5444 S 4050 W
- 5412 S 3925 W
- 3517 W 4835 S Unit 27
- 3509 W 4835 S Unit 26
Your Personal Tour Guide
Ask me questions while you tour the home.