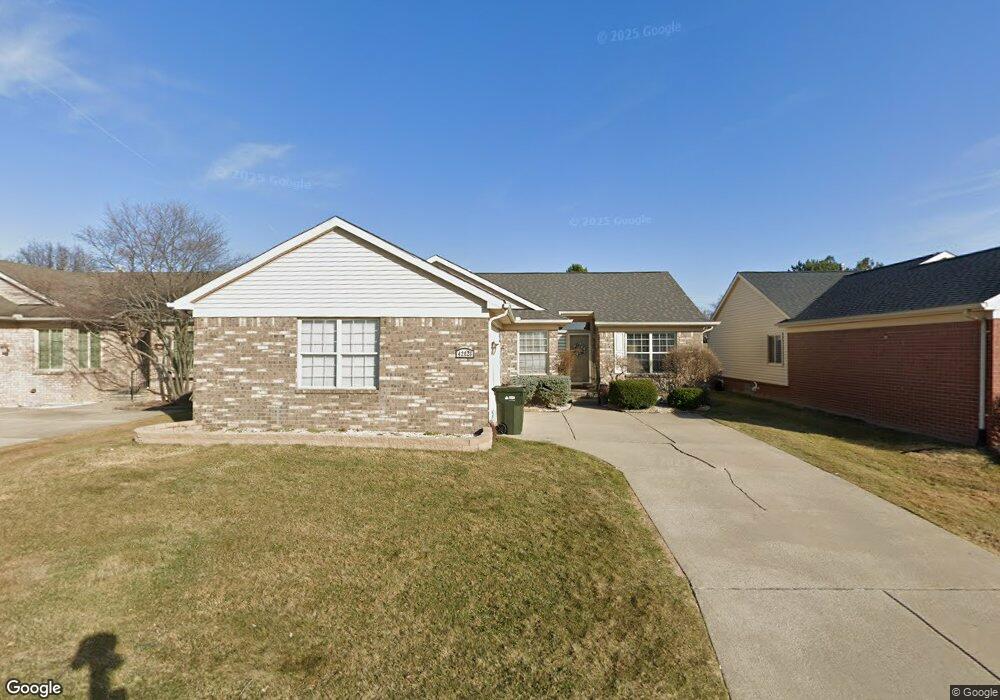
42826 Hunt Club Blvd Unit 36 Sterling Heights, MI 48314
Estimated Value: $339,411 - $429,000
3
Beds
2
Baths
1,524
Sq Ft
$252/Sq Ft
Est. Value
About This Home
This home is located at 42826 Hunt Club Blvd Unit 36, Sterling Heights, MI 48314 and is currently estimated at $383,353, approximately $251 per square foot. 42826 Hunt Club Blvd Unit 36 is a home located in Macomb County with nearby schools including Schuchard Elementary School, Frank Jeannette Junior High School, and Adlai Stevenson High School.
Ownership History
Date
Name
Owned For
Owner Type
Purchase Details
Closed on
Apr 4, 2013
Sold by
Shina Sally and Naeem Salli
Bought by
Shina Sally and Sawa Sonya
Current Estimated Value
Purchase Details
Closed on
Jul 15, 2009
Sold by
Mortgage Electronic Registration Systems
Bought by
Federal National Mortgage Association
Purchase Details
Closed on
Jul 10, 2009
Sold by
Alhasan Ashraf and Alhasan Mona
Bought by
Mortgage Electronic Registration Systems
Purchase Details
Closed on
Mar 28, 2005
Sold by
Harris Paul and Harris Zoe
Bought by
Alhasan Ashraf and Alhasan Mona
Home Financials for this Owner
Home Financials are based on the most recent Mortgage that was taken out on this home.
Original Mortgage
$182,400
Interest Rate
6.06%
Mortgage Type
New Conventional
Create a Home Valuation Report for This Property
The Home Valuation Report is an in-depth analysis detailing your home's value as well as a comparison with similar homes in the area
Home Values in the Area
Average Home Value in this Area
Purchase History
| Date | Buyer | Sale Price | Title Company |
|---|---|---|---|
| Shina Sally | -- | None Available | |
| Federal National Mortgage Association | -- | None Available | |
| Mortgage Electronic Registration Systems | $177,952 | None Available | |
| Alhasan Ashraf | $228,000 | Title One Inc |
Source: Public Records
Mortgage History
| Date | Status | Borrower | Loan Amount |
|---|---|---|---|
| Previous Owner | Alhasan Ashraf | $182,400 | |
| Closed | Alhasan Ashraf | $22,800 |
Source: Public Records
Tax History Compared to Growth
Tax History
| Year | Tax Paid | Tax Assessment Tax Assessment Total Assessment is a certain percentage of the fair market value that is determined by local assessors to be the total taxable value of land and additions on the property. | Land | Improvement |
|---|---|---|---|---|
| 2025 | $3,768 | $166,700 | $0 | $0 |
| 2024 | $3,445 | $158,100 | $0 | $0 |
| 2023 | $3,252 | $144,800 | $0 | $0 |
| 2022 | $3,391 | $131,700 | $0 | $0 |
| 2021 | $3,321 | $126,800 | $0 | $0 |
| 2020 | $2,962 | $124,300 | $0 | $0 |
| 2019 | $2,832 | $114,300 | $0 | $0 |
| 2018 | $3,071 | $107,100 | $0 | $0 |
| 2017 | $2,932 | $101,500 | $20,000 | $81,500 |
| 2016 | $2,832 | $101,500 | $0 | $0 |
| 2015 | -- | $92,800 | $0 | $0 |
| 2014 | -- | $76,700 | $0 | $0 |
Source: Public Records
Map
Nearby Homes
- 3670 Warwick Dr
- 4123 Blossom Dr
- 4044 Blossom Dr
- 42419 Magnolia Dr
- 4118 Spring Meadow Dr
- 4076 Spring Meadow Dr
- 4060 Blossom Dr
- 42435 Magnolia Dr
- 4172 Blossom Dr
- 42512 Saddle Ln
- 42040 Ryan Rd
- 42512 Beechwood Dr Unit 114
- 43573 Perignon Dr
- 42739 Pond View Dr
- 43681 Perignon Dr Unit 18
- 4054 Jayden Ct
- 3715 Knightbridge Cir
- 4825 MacEri Cir
- 43746 Via Antonio Dr
- 42152 Tessmer Dr
- 42814 Hunt Club Blvd Unit 35
- 42850 Hunt Club Blvd
- 42850 Hunt Club Blvd Unit 38
- 42802 Hunt Club Blvd
- 42802 Hunt Club Blvd
- 42833 Hunt Club Blvd
- 42821 Hunt Club Blvd Unit 91
- 42845 Hunt Club Blvd
- 42862 Hunt Club Blvd Unit 39
- 42809 Hunt Club Blvd Unit 92
- 42809 Hunt Club Blvd
- 42790 Hunt Club Blvd
- 42797 Hunt Club Blvd Unit 93
- 42797 Hunt Club Blvd
- 42881 Hunt Club Blvd Unit 88
- 42874 Hunt Club Blvd Unit 40
- 42874 Hunt Club Blvd
- 42770 Hunt Club Blvd Unit 32
- 42886 Hunt Club Blvd Unit 41
- 42886 Hunt Club Blvd