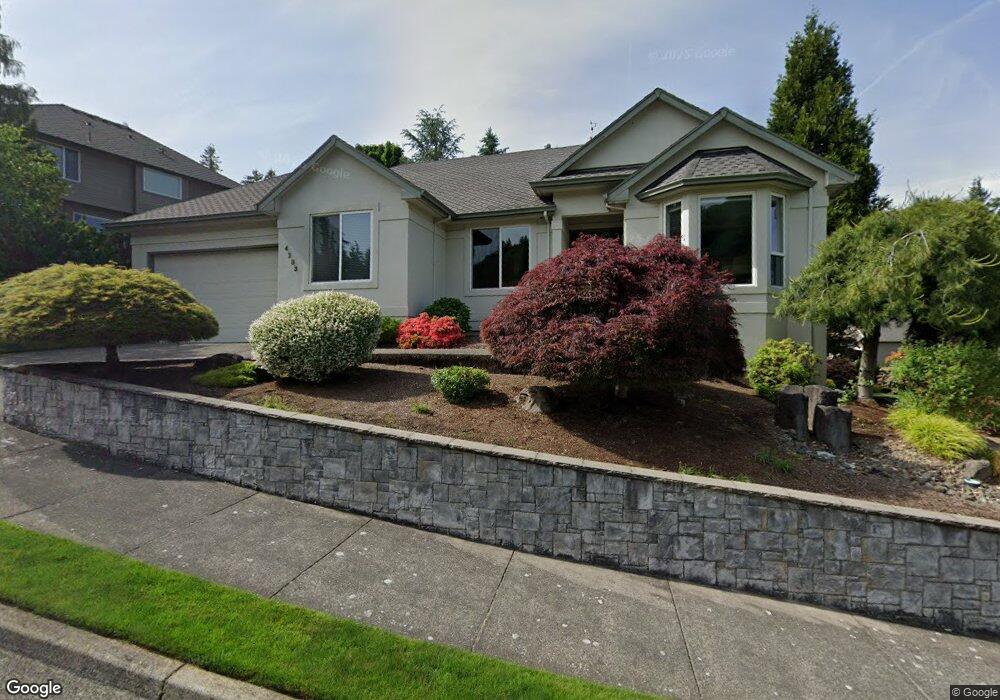
4283 SE Augusta Loop Gresham, OR 97080
Gresham Butte NeighborhoodEstimated Value: $648,000 - $820,000
4
Beds
3
Baths
2,780
Sq Ft
$258/Sq Ft
Est. Value
About This Home
This home is located at 4283 SE Augusta Loop, Gresham, OR 97080 and is currently estimated at $717,396, approximately $258 per square foot. 4283 SE Augusta Loop is a home located in Multnomah County with nearby schools including Hogan Cedars Elementary School, Dexter McCarty Middle School, and Gresham High School.
Ownership History
Date
Name
Owned For
Owner Type
Purchase Details
Closed on
May 23, 2023
Sold by
Nilson Kevin J
Bought by
Kevin J Nilson Living Trust
Current Estimated Value
Home Financials for this Owner
Home Financials are based on the most recent Mortgage that was taken out on this home.
Original Mortgage
$442,400
Interest Rate
6.32%
Mortgage Type
New Conventional
Purchase Details
Closed on
Mar 30, 2023
Sold by
Norman D Logan Credit Shelter Trust
Bought by
Nilson Kevin J
Home Financials for this Owner
Home Financials are based on the most recent Mortgage that was taken out on this home.
Original Mortgage
$442,400
Interest Rate
6.32%
Mortgage Type
New Conventional
Purchase Details
Closed on
Dec 15, 2011
Sold by
Logan Kathleen R
Bought by
Logan Kathleen R and Norman D Logan Credit Shelter Trust Of T
Purchase Details
Closed on
Feb 4, 1999
Sold by
Lone Oak Construction Inc
Bought by
Logan Norman D and Logan Kathleen R
Purchase Details
Closed on
Nov 24, 1997
Sold by
Cgc Inc
Bought by
Lone Oak Construction Inc
Create a Home Valuation Report for This Property
The Home Valuation Report is an in-depth analysis detailing your home's value as well as a comparison with similar homes in the area
Home Values in the Area
Average Home Value in this Area
Purchase History
| Date | Buyer | Sale Price | Title Company |
|---|---|---|---|
| Kevin J Nilson Living Trust | -- | None Listed On Document | |
| Nilson Kevin J | $627,000 | Fidelity National Title Compan | |
| Logan Kathleen R | -- | None Available | |
| Logan Norman D | $381,656 | Ticor Title Insurance | |
| Lone Oak Construction Inc | $64,505 | Fidelity National Title Co |
Source: Public Records
Mortgage History
| Date | Status | Borrower | Loan Amount |
|---|---|---|---|
| Previous Owner | Nilson Kevin J | $442,400 |
Source: Public Records
Tax History
| Year | Tax Paid | Tax Assessment Tax Assessment Total Assessment is a certain percentage of the fair market value that is determined by local assessors to be the total taxable value of land and additions on the property. | Land | Improvement |
|---|---|---|---|---|
| 2025 | $10,785 | $529,990 | -- | -- |
| 2024 | $10,324 | $514,560 | -- | -- |
| 2023 | $9,406 | $499,580 | $0 | $0 |
| 2022 | $9,143 | $485,030 | $0 | $0 |
| 2021 | $8,913 | $470,910 | $0 | $0 |
| 2020 | $8,274 | $457,200 | $0 | $0 |
| 2019 | $8,166 | $443,890 | $0 | $0 |
| 2018 | $7,787 | $430,970 | $0 | $0 |
| 2017 | $7,471 | $418,420 | $0 | $0 |
| 2016 | $6,425 | $406,240 | $0 | $0 |
Source: Public Records
Map
Nearby Homes
- 50 SE Avondale Ct
- 43 SE 46th Dr
- 94 SE 46th Dr
- 0 SE Honors Place Unit 189 24575382
- 0 SE Honors Place Unit 190 24628640
- 4617 SE Honors Place
- 4647 SE Honors Dr
- 350 SW 37th Terrace
- 3544 SE Deer Creek Way
- 4660 SE Honors Dr
- 652 SW 49th Dr
- 723 SW 49th Dr
- 23040 SE Yellowhammer St
- 242 SE 29th St
- 8970 SE Kingswood Way
- 1320 SW 31st St
- 2440 SE Regner Rd
- 1278 SW 27th Ct
- 3120 SW Orchard Place
- 2581 SE Morlan Way
- 4296 SE Bethesda Place
- 4246 SE Bethesda Place
- 4273 SE Augusta Loop
- 4206 SE Bethesda Place
- 4290 SE Augusta Loop
- 4275 SE Augusta Loop
- 4277 SE Augusta Loop
- 4292 SE Augusta Loop
- 4295 SE Augusta Loop
- 4263 SE Augusta Loop
- 4280 SE Augusta Loop
- 4196 SE Bethesda Place
- 4294 SE Augusta Loop
- 4270 SE Augusta Loop
- 4248 SE Augusta Way
- 4296 SE Augusta Loop
- 4208 SE Augusta Way
- 4299 SE Augusta Loop
- 4584 SE Bethesda Dr
- 4186 SE Bethesda Place
Your Personal Tour Guide
Ask me questions while you tour the home.