Estimated Value: $387,000 - $423,000
3
Beds
2
Baths
1,790
Sq Ft
$229/Sq Ft
Est. Value
About This Home
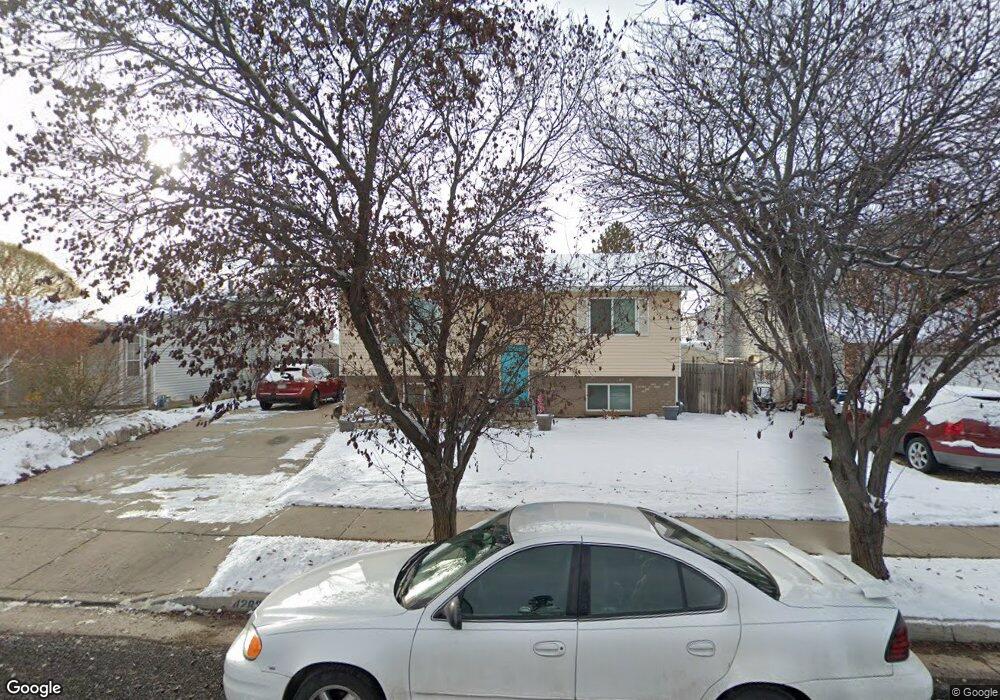
This home is located at 4283 W 5550 S, Roy, UT 84067 and is currently estimated at $409,346, approximately $228 per square foot. 4283 W 5550 S is a home located in Weber County with nearby schools including Freedom School, Roy Junior High School, and Roy High School.
Ownership History
Date
Name
Owned For
Owner Type
Purchase Details
Closed on
May 5, 2005
Sold by
Child Brandon L and Spencer Chyann
Bought by
Child Brandon L
Current Estimated Value
Purchase Details
Closed on
Nov 29, 2004
Sold by
Bramwell Melinda
Bought by
Child Brandon L
Home Financials for this Owner
Home Financials are based on the most recent Mortgage that was taken out on this home.
Original Mortgage
$115,192
Outstanding Balance
$57,650
Interest Rate
5.72%
Mortgage Type
FHA
Estimated Equity
$351,696
Purchase Details
Closed on
Feb 2, 2000
Sold by
Bramwell Steven T
Bought by
Bramwell Melinda
Home Financials for this Owner
Home Financials are based on the most recent Mortgage that was taken out on this home.
Original Mortgage
$85,500
Interest Rate
7.96%
Mortgage Type
Purchase Money Mortgage
Create a Home Valuation Report for This Property
The Home Valuation Report is an in-depth analysis detailing your home's value as well as a comparison with similar homes in the area
Home Values in the Area
Average Home Value in this Area
Purchase History
| Date | Buyer | Sale Price | Title Company |
|---|---|---|---|
| Child Brandon L | -- | Bonneville Title Company Cle | |
| Child Brandon L | -- | Bonneville Title Company | |
| Bramwell Melinda | -- | Founders Title Co |
Source: Public Records
Mortgage History
| Date | Status | Borrower | Loan Amount |
|---|---|---|---|
| Open | Child Brandon L | $115,192 | |
| Previous Owner | Bramwell Melinda | $85,500 | |
| Closed | Child Brandon L | $6,500 |
Source: Public Records
Tax History Compared to Growth
Tax History
| Year | Tax Paid | Tax Assessment Tax Assessment Total Assessment is a certain percentage of the fair market value that is determined by local assessors to be the total taxable value of land and additions on the property. | Land | Improvement |
|---|---|---|---|---|
| 2025 | $2,365 | $370,417 | $128,331 | $242,086 |
| 2024 | $2,291 | $198,549 | $70,589 | $127,960 |
| 2023 | $2,211 | $191,950 | $63,264 | $128,686 |
| 2022 | $2,412 | $217,800 | $58,274 | $159,526 |
| 2021 | $1,847 | $271,000 | $77,215 | $193,785 |
| 2020 | $1,742 | $235,000 | $77,215 | $157,785 |
| 2019 | $1,764 | $225,000 | $42,736 | $182,264 |
| 2018 | $1,626 | $194,000 | $37,621 | $156,379 |
| 2017 | $1,525 | $170,000 | $37,621 | $132,379 |
| 2016 | $1,440 | $85,999 | $20,512 | $65,487 |
| 2015 | $1,257 | $76,338 | $20,512 | $55,826 |
| 2014 | $1,213 | $72,509 | $17,595 | $54,914 |
Source: Public Records
Map
Nearby Homes
- 4309 W 5430 St #B S
- 5539 S 4175 W
- 4337 W 5430 S Unit A
- 5644 S 4075 W
- 4449 W 5325 S
- 5465 S 4050 W
- 5270 S 4200 W
- 5778 S 4075 W
- 4632 W 5750 S
- 5116 S 4300 W
- 4164 W 5950 S
- 3923 W 5700 S
- 4700 W 5500 S
- 462 S 4450 W Unit 504
- 5235 Midland Dr
- 3832 W 5625 S
- 3809 W 5625 S
- 4276 W 6025 S
- 5856 S 3950 W
- 4218 W 5050 S