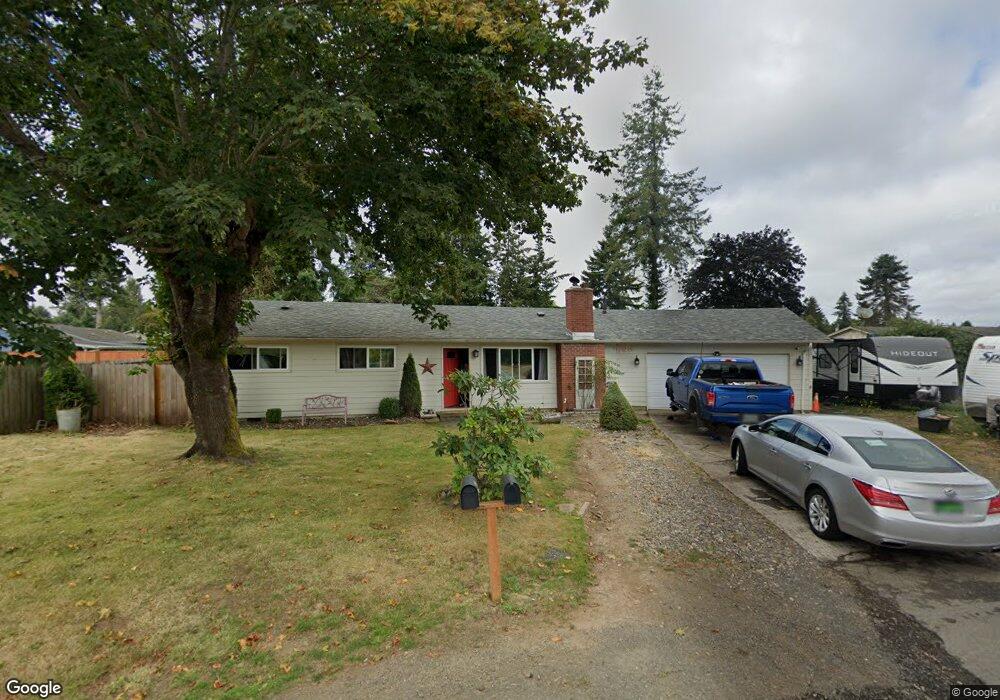
42835 Hillcrest Loop Astoria, OR 97103
Estimated Value: $414,000 - $468,000
3
Beds
2
Baths
1,317
Sq Ft
$329/Sq Ft
Est. Value
About This Home
This home is located at 42835 Hillcrest Loop, Astoria, OR 97103 and is currently estimated at $433,931, approximately $329 per square foot. 42835 Hillcrest Loop is a home located in Clatsop County with nearby schools including Hilda Lahti Elementary School and Knappa High School.
Ownership History
Date
Name
Owned For
Owner Type
Purchase Details
Closed on
Dec 6, 2018
Sold by
Wray David G and Wray Casey M
Bought by
Yates Jessica and Bailey Talma D
Current Estimated Value
Home Financials for this Owner
Home Financials are based on the most recent Mortgage that was taken out on this home.
Original Mortgage
$234,671
Outstanding Balance
$206,346
Interest Rate
4.8%
Mortgage Type
FHA
Estimated Equity
$227,585
Purchase Details
Closed on
May 9, 2007
Sold by
Bemis Aaron R and Bemis Elizabeth A
Bought by
Wray David G and Wray Casey M
Home Financials for this Owner
Home Financials are based on the most recent Mortgage that was taken out on this home.
Original Mortgage
$230,859
Interest Rate
6.17%
Mortgage Type
VA
Create a Home Valuation Report for This Property
The Home Valuation Report is an in-depth analysis detailing your home's value as well as a comparison with similar homes in the area
Home Values in the Area
Average Home Value in this Area
Purchase History
| Date | Buyer | Sale Price | Title Company |
|---|---|---|---|
| Yates Jessica | $239,000 | Ticor Title | |
| Wray David G | $226,000 | Ticor Title |
Source: Public Records
Mortgage History
| Date | Status | Borrower | Loan Amount |
|---|---|---|---|
| Open | Yates Jessica | $234,671 | |
| Previous Owner | Wray David G | $230,859 |
Source: Public Records
Tax History Compared to Growth
Tax History
| Year | Tax Paid | Tax Assessment Tax Assessment Total Assessment is a certain percentage of the fair market value that is determined by local assessors to be the total taxable value of land and additions on the property. | Land | Improvement |
|---|---|---|---|---|
| 2025 | $2,391 | $173,295 | -- | -- |
| 2024 | $2,337 | $168,249 | -- | -- |
| 2023 | $2,255 | $163,350 | $0 | $0 |
| 2022 | $2,211 | $158,594 | $0 | $0 |
| 2021 | $1,718 | $153,976 | $0 | $0 |
| 2020 | $1,935 | $149,492 | $0 | $0 |
| 2019 | $1,870 | $145,139 | $0 | $0 |
| 2018 | $1,776 | $140,913 | $0 | $0 |
| 2017 | $1,697 | $136,809 | $0 | $0 |
| 2016 | $1,803 | $132,825 | $35,119 | $97,706 |
| 2015 | $1,743 | $128,958 | $34,097 | $94,861 |
| 2014 | $1,655 | $125,203 | $0 | $0 |
| 2013 | -- | $121,557 | $0 | $0 |
Source: Public Records
Map
Nearby Homes
- 41965 Wickiup Terrace Ln
- 0 V L 19 97ac Hillcrest Loop
- 43018 Hillcrest Loop
- V/L .50ac Crest Dr
- 0 Crest Dr Unit 300 24581166
- 92201 Crest Dr
- 92700 Holly Ln
- 92700 Holly Rd
- 0 Knappa Dock Rd
- 0 Adj To 93101 Knappa Dock Rd
- 04101 Hillcrest Loop
- 93270 Knappa Platt Rd
- 0 Hillcrest Loop Unit 4101
- 0 Hillcrest Loop Unit 432066736
- 42996 Valley Creek Ln
- 0 Homestead Ln Unit 704840619
- 0 Homestead Ln Unit 25-950
- 41138 Hillcrest Loop
- 40801 Savola Ln
- 92693 Tt Larson Rd
- 42835 Hillcrest Lp
- 42847 Hillcrest Loop
- 41997 Wickiup Terrace Ln
- 41991 Wickiup Terrace Ln
- 41986 Meyer Ln
- 41977 Wickiup Terrace Ln
- 41978 Meyer Ln
- 42859 Hillcrest Loop
- 42850 Hillcrest Loop
- 42002 Wickiup Terrace Ln
- 41990 Wickiup Terrace Ln
- 41991 Meyer Ln
- 41970 Meyer Ln
- 41976 Wickiup Terrace Ln
- 41977 Meyer Ln
- 42834 Hillcrest Loop
- 41962 Meyer Ln
- 41957 Wickiup Terrace Ln
- 41966 Wickiup Terrace Ln
- 41971 Meyer Ln