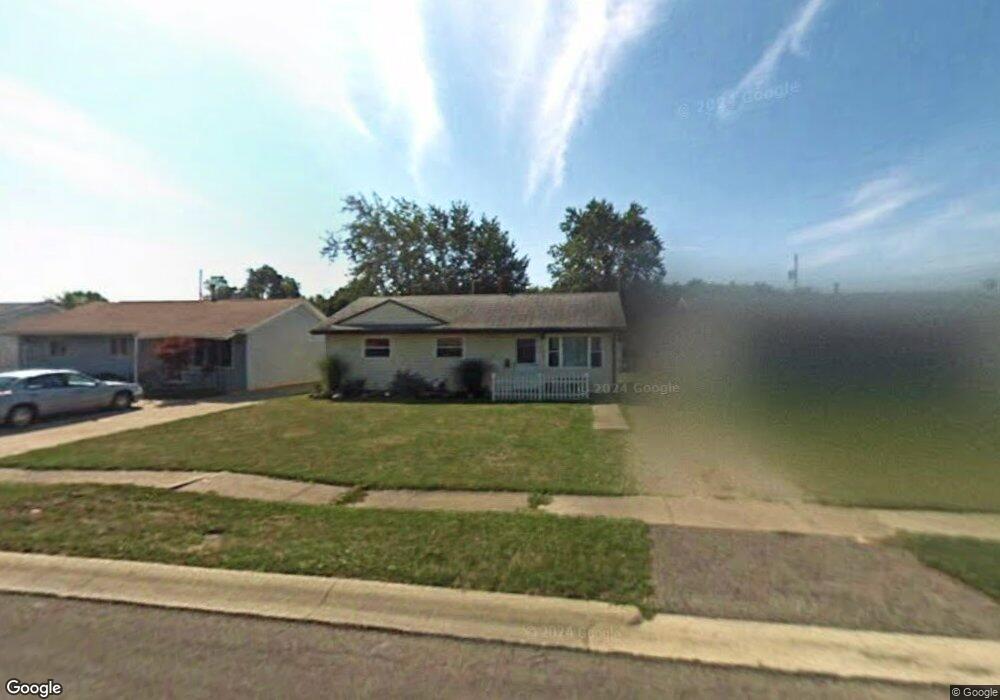
4284 Knickerbocker Rd Sheffield Lake, OH 44054
Estimated Value: $159,000 - $187,000
3
Beds
1
Bath
988
Sq Ft
$175/Sq Ft
Est. Value
About This Home
This home is located at 4284 Knickerbocker Rd, Sheffield Lake, OH 44054 and is currently estimated at $172,470, approximately $174 per square foot. 4284 Knickerbocker Rd is a home located in Lorain County with nearby schools including Knollwood Elementary School, Brookside Intermediate School, and Brookside Middle School.
Ownership History
Date
Name
Owned For
Owner Type
Purchase Details
Closed on
Mar 3, 2009
Sold by
Mccallie John C
Bought by
Mccallie Sarah A and Mccallie John C
Current Estimated Value
Purchase Details
Closed on
Mar 26, 2003
Sold by
Mccallie John C and Collins Shawna R
Bought by
Mccallie John C
Purchase Details
Closed on
Apr 14, 2000
Sold by
Foley Ryan T and Foley Kimberly A
Bought by
Mccallie John C and Collins Shawna R
Home Financials for this Owner
Home Financials are based on the most recent Mortgage that was taken out on this home.
Original Mortgage
$85,792
Outstanding Balance
$29,413
Interest Rate
8.24%
Mortgage Type
FHA
Estimated Equity
$143,057
Purchase Details
Closed on
Feb 9, 1996
Sold by
Eskut Deborah A
Bought by
Foley Ryan T and Foley Kimberly A
Home Financials for this Owner
Home Financials are based on the most recent Mortgage that was taken out on this home.
Original Mortgage
$73,150
Interest Rate
7.11%
Mortgage Type
New Conventional
Create a Home Valuation Report for This Property
The Home Valuation Report is an in-depth analysis detailing your home's value as well as a comparison with similar homes in the area
Home Values in the Area
Average Home Value in this Area
Purchase History
| Date | Buyer | Sale Price | Title Company |
|---|---|---|---|
| Mccallie Sarah A | -- | None Available | |
| Mccallie Sarah A | -- | None Available | |
| Mccallie John C | $42,600 | -- | |
| Mccallie John C | $86,500 | Guardian Title | |
| Foley Ryan T | $77,000 | -- |
Source: Public Records
Mortgage History
| Date | Status | Borrower | Loan Amount |
|---|---|---|---|
| Open | Mccallie John C | $85,792 | |
| Closed | Foley Ryan T | $73,150 |
Source: Public Records
Tax History Compared to Growth
Tax History
| Year | Tax Paid | Tax Assessment Tax Assessment Total Assessment is a certain percentage of the fair market value that is determined by local assessors to be the total taxable value of land and additions on the property. | Land | Improvement |
|---|---|---|---|---|
| 2024 | $2,433 | $46,736 | $14,886 | $31,850 |
| 2023 | $2,061 | $34,801 | $11,193 | $23,608 |
| 2022 | $2,041 | $34,801 | $11,193 | $23,608 |
| 2021 | $2,053 | $34,801 | $11,193 | $23,608 |
| 2020 | $1,879 | $29,140 | $9,370 | $19,770 |
| 2019 | $1,866 | $29,110 | $9,370 | $19,740 |
| 2018 | $1,874 | $29,110 | $9,370 | $19,740 |
| 2017 | $1,717 | $24,320 | $8,490 | $15,830 |
| 2016 | $1,733 | $24,320 | $8,490 | $15,830 |
| 2015 | $1,710 | $24,320 | $8,490 | $15,830 |
| 2014 | $1,680 | $26,330 | $9,190 | $17,140 |
| 2013 | $1,672 | $26,330 | $9,190 | $17,140 |
Source: Public Records
Map
Nearby Homes
- 4283 Holl Ave
- 4286 Holl Ave
- 4272 Brockley Ave
- 4154 Belle Ave
- 4146 Belle Ave
- 4118 Holl Ave
- 729 Kenilworth Ave
- 687 Rowelyn Ave
- VL Maplewood Ave
- 0 Kenilworth Ave
- 786 Oliver St
- 931 West Dr
- 827 West Dr
- 738 W Shore Blvd
- 631 Idlewood Ave
- 644 Pasadena Ave
- 640 Pasadena Ave
- 992 Lakewood Beach Dr
- 4419 E Lake Rd
- 0 E Lake Rd
- 4286 Knickerbocker Rd
- 4280 Knickerbocker Rd
- 4272 Knickerbocker Rd
- 4290 Knickerbocker Rd
- 4285 Holl Ave
- 4279 Holl Ave
- 4268 Knickerbocker Rd
- 4308 Knickerbocker Rd
- 4289 Holl Ave
- 4271 Holl Ave
- 4283 Knickerbocker Rd
- 4279 Knickerbocker Rd
- 4285 Knickerbocker Rd
- 4307 Holl Ave
- 4267 Holl Ave
- 4310 Knickerbocker Rd
- 4271 Knickerbocker Rd
- 4289 Knickerbocker Rd
- 4267 Knickerbocker Rd
- 4309 Holl Ave