4285 E 6th St Silver Springs, NV 89429
Estimated Value: $38,000 - $167,000
Studio
--
Bath
--
Sq Ft
201,247
Sq Ft
About This Home
This home is located at 4285 E 6th St, Silver Springs, NV 89429 and is currently estimated at $73,316. 4285 E 6th St is a home located in Lyon County with nearby schools including Silver Springs Elementary School and Silver Stage High School.
Ownership History
Date
Name
Owned For
Owner Type
Purchase Details
Closed on
May 6, 2022
Sold by
Bruce Cook
Bought by
Bruce And Kathleen Cook Living Trust
Current Estimated Value
Purchase Details
Closed on
May 5, 2022
Sold by
Bruce Cook
Bought by
Bruce And Kathleen Cook Living Trust
Purchase Details
Closed on
Jun 13, 2018
Sold by
Eldridge Charles M and Eldridge Gayleen K
Bought by
Cook Bruce
Home Financials for this Owner
Home Financials are based on the most recent Mortgage that was taken out on this home.
Original Mortgage
$32,000
Interest Rate
4.5%
Mortgage Type
Purchase Money Mortgage
Purchase Details
Closed on
Oct 18, 2011
Sold by
Cummings Scott
Bought by
Eldridge Charles M and Eldridge Gayleen K
Purchase Details
Closed on
Apr 27, 2011
Sold by
Bryan Nikki A
Bought by
Cummings Scott
Create a Home Valuation Report for This Property
The Home Valuation Report is an in-depth analysis detailing your home's value as well as a comparison with similar homes in the area
Home Values in the Area
Average Home Value in this Area
Purchase History
| Date | Buyer | Sale Price | Title Company |
|---|---|---|---|
| Bruce And Kathleen Cook Living Trust | -- | None Listed On Document | |
| Bruce And Kathleen Cook Living Trust | -- | None Listed On Document | |
| Cook Bruce | $40,000 | Western Title Co | |
| Eldridge Charles M | $4,000 | Title Service & Escrow Co | |
| Cummings Scott | $2,500 | None Available |
Source: Public Records
Mortgage History
| Date | Status | Borrower | Loan Amount |
|---|---|---|---|
| Previous Owner | Cook Bruce | $32,000 |
Source: Public Records
Tax History
| Year | Tax Paid | Tax Assessment Tax Assessment Total Assessment is a certain percentage of the fair market value that is determined by local assessors to be the total taxable value of land and additions on the property. | Land | Improvement |
|---|---|---|---|---|
| 2025 | $187 | $8,602 | $7,000 | $1,602 |
| 2024 | $173 | $8,693 | $7,000 | $1,692 |
| 2023 | $173 | $7,881 | $6,370 | $1,511 |
| 2022 | $132 | $7,710 | $6,125 | $1,585 |
| 2021 | $122 | $7,736 | $6,125 | $1,611 |
| 2020 | $113 | $7,751 | $6,130 | $1,621 |
| 2019 | $106 | $7,708 | $6,130 | $1,578 |
| 2018 | $101 | $6,436 | $4,900 | $1,536 |
| 2017 | $97 | $5,355 | $3,780 | $1,575 |
| 2016 | $94 | $3,279 | $1,960 | $1,319 |
| 2015 | $94 | $3,282 | $1,960 | $1,322 |
| 2014 | $93 | $2,750 | $1,960 | $790 |
Source: Public Records
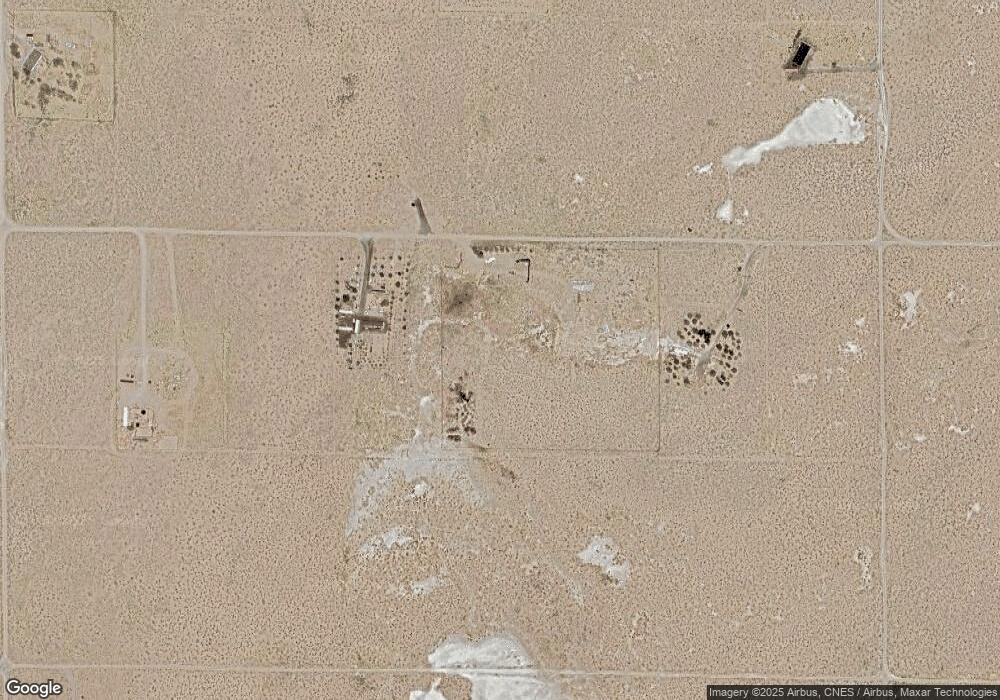
Map
Nearby Homes
- 4215 E 6th St
- 4345 E 6th St
- 4155 E 6th St
- 4405 E 6th St
- 4280 E 6th St
- 4340 E 6th St
- 4210 E 6th St Unit 13
- 4400 E 6th St
- 4210 to 4460 6th St
- 4460 E 7th St
- 4460 E 6th St
- 4535 E 6th St
- 4215 E 5th St
- 4215 E 5th St Unit 4
- 4285 E 5th St
- 4530 6th St
- 4030 E 6th St
- 4595 E 6th St
- 4285 E Karyn St
- 4340 E 5th St
Your Personal Tour Guide
Ask me questions while you tour the home.