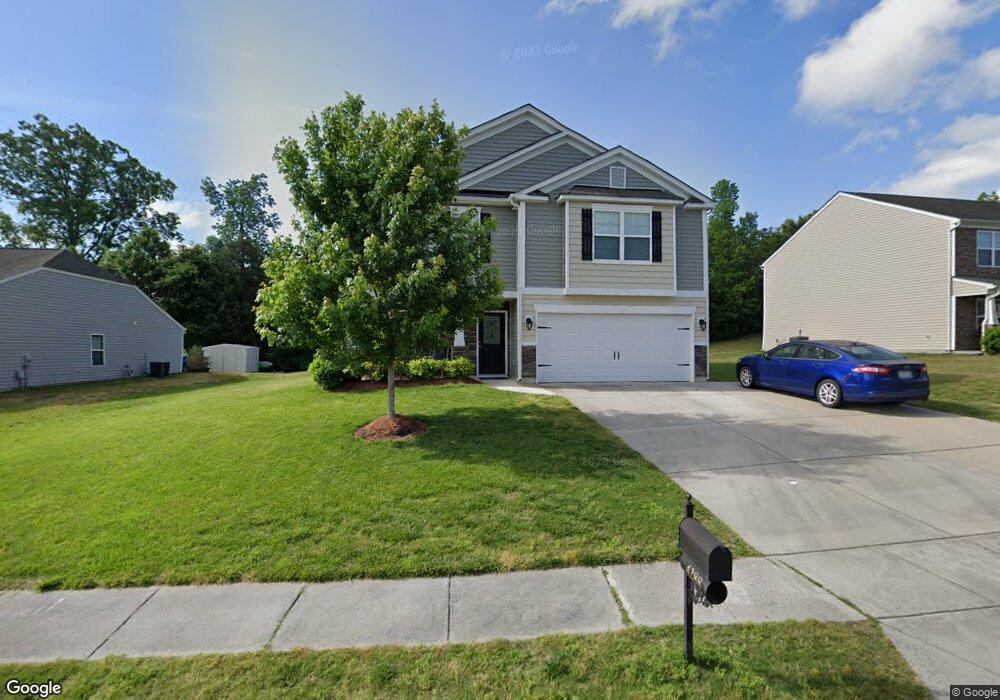
4288 Tucker Chase Dr Unit 131 Midland, NC 28107
Estimated Value: $385,250 - $429,000
4
Beds
3
Baths
2,231
Sq Ft
$183/Sq Ft
Est. Value
About This Home
This home is located at 4288 Tucker Chase Dr Unit 131, Midland, NC 28107 and is currently estimated at $407,563, approximately $182 per square foot. 4288 Tucker Chase Dr Unit 131 is a home located in Cabarrus County with nearby schools including Bethel Elementary School, C.C. Griffin Middle School, and Central Cabarrus High School.
Ownership History
Date
Name
Owned For
Owner Type
Purchase Details
Closed on
Aug 22, 2022
Sold by
Mattingly Brenda S and Mattingly Stephen S
Bought by
Fkh Sfr Llp
Current Estimated Value
Purchase Details
Closed on
Aug 2, 2013
Sold by
Regent Homes Inc
Bought by
Mattingly Stephen S and Mattingly Brenda S
Home Financials for this Owner
Home Financials are based on the most recent Mortgage that was taken out on this home.
Original Mortgage
$159,340
Interest Rate
4.29%
Mortgage Type
New Conventional
Purchase Details
Closed on
Feb 19, 2013
Sold by
Tucker Chase Llc
Bought by
Regent Homes Inc
Home Financials for this Owner
Home Financials are based on the most recent Mortgage that was taken out on this home.
Original Mortgage
$3,000,000
Interest Rate
3.43%
Mortgage Type
Unknown
Create a Home Valuation Report for This Property
The Home Valuation Report is an in-depth analysis detailing your home's value as well as a comparison with similar homes in the area
Home Values in the Area
Average Home Value in this Area
Purchase History
| Date | Buyer | Sale Price | Title Company |
|---|---|---|---|
| Fkh Sfr Llp | $425,000 | Chicago Title | |
| Mattingly Stephen S | $156,500 | None Available | |
| Regent Homes Inc | $243,000 | None Available |
Source: Public Records
Mortgage History
| Date | Status | Borrower | Loan Amount |
|---|---|---|---|
| Previous Owner | Mattingly Stephen S | $159,340 | |
| Previous Owner | Regent Homes Inc | $3,000,000 |
Source: Public Records
Tax History Compared to Growth
Tax History
| Year | Tax Paid | Tax Assessment Tax Assessment Total Assessment is a certain percentage of the fair market value that is determined by local assessors to be the total taxable value of land and additions on the property. | Land | Improvement |
|---|---|---|---|---|
| 2025 | $2,786 | $359,050 | $83,000 | $276,050 |
| 2024 | $2,786 | $359,050 | $83,000 | $276,050 |
| 2023 | $2,153 | $224,230 | $45,000 | $179,230 |
| 2022 | $2,153 | $224,230 | $45,000 | $179,230 |
| 2021 | $2,153 | $224,230 | $45,000 | $179,230 |
| 2020 | $2,136 | $222,470 | $45,000 | $177,470 |
| 2019 | $1,498 | $156,070 | $29,000 | $127,070 |
| 2018 | $1,436 | $156,070 | $29,000 | $127,070 |
| 2017 | $1,405 | $156,070 | $29,000 | $127,070 |
| 2016 | $1,405 | $169,080 | $30,000 | $139,080 |
| 2015 | $270 | $169,080 | $30,000 | $139,080 |
| 2014 | $270 | $169,080 | $30,000 | $139,080 |
Source: Public Records
Map
Nearby Homes
- 11824 Paver Ln
- 4316 Tucker Chase Dr
- 11790 Thurber Place
- 4245 Wesley Dr
- 4200 Wesley Dr
- 4200 Nc Hwy 24 27 Hwy
- 0000 Nc Hwy 24 27 None
- 11060 Teresia Ln
- 4207 Amanda Dr
- 3987 Tersk Dr
- 3578 Saddlebrook Dr
- 12560 Highway 601
- 12536 Gotland Rd Unit 330
- 12540 Gotland Rd Unit 329
- 12982 Hill Pine Rd Unit 251
- 12926 Hill Pine Rd
- Plan 2338 Modeled at Midland Crossing
- Plan 2177 at Midland Crossing
- Plan 3147 at Midland Crossing
- Plan 2074 at Midland Crossing
- 4288 Tucker Chase Dr
- 4282 Tucker Chase Dr Unit 130
- 4296 Tucker Chase Dr
- 4153 Cordell Ct
- 4276 Tucker Chase Dr Unit 47
- 4316 Tucker Chase Dr Unit 133
- 4157 Cordell Ct
- 11796 Thurber St
- 11810 Paver Ln
- 11790 Thurber Place Unit Lot 25
- 4281 Tucker Field Rd
- 4281 Tucker Chase Dr
- 4275 Tucker Field Rd
- 4161 Cordell Ct
- 4270 Tucker Chase Dr
- 11818 Paver Ln
- 4150 Cordell Ct
- 4329 Tucker Chase Dr Unit 47
- 4329 Tucker Chase Dr
- 4267 Tucker Chase Dr