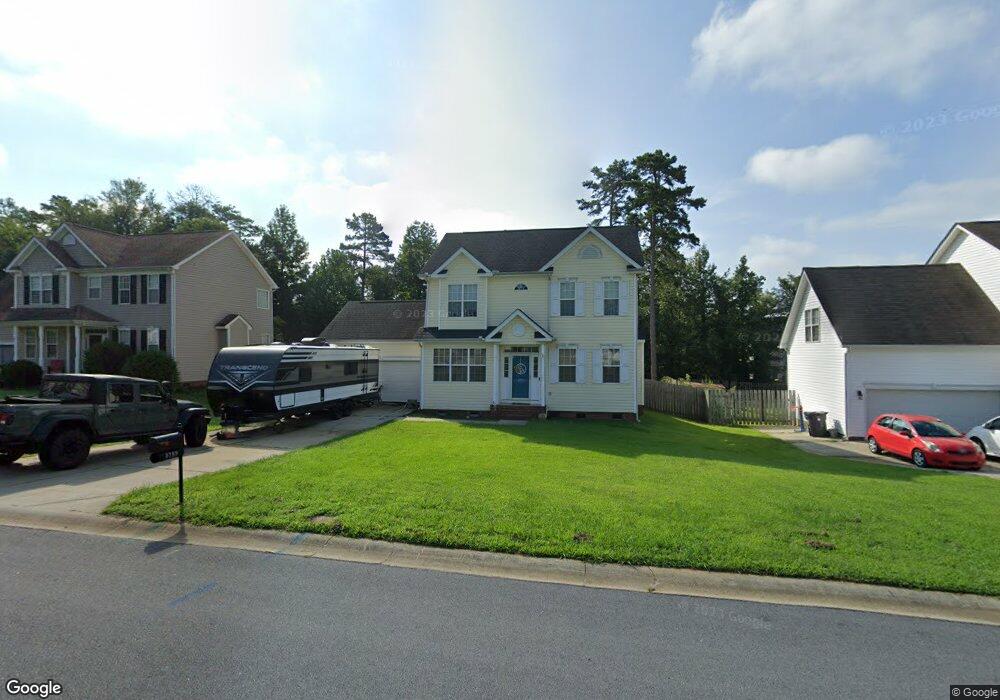
4289 Deacon Ct SW Concord, NC 28025
Estimated Value: $340,000 - $367,000
3
Beds
3
Baths
1,677
Sq Ft
$208/Sq Ft
Est. Value
About This Home
This home is located at 4289 Deacon Ct SW, Concord, NC 28025 and is currently estimated at $348,935, approximately $208 per square foot. 4289 Deacon Ct SW is a home located in Cabarrus County with nearby schools including Rocky River Elementary School, J.N. Fries Middle School, and Branch Christian Academy.
Ownership History
Date
Name
Owned For
Owner Type
Purchase Details
Closed on
Jun 26, 2015
Sold by
Reynolds John D and Reynolds Christie A
Bought by
Bryant Patrick and Bryant Ashleigh
Current Estimated Value
Home Financials for this Owner
Home Financials are based on the most recent Mortgage that was taken out on this home.
Original Mortgage
$132,600
Outstanding Balance
$102,702
Interest Rate
3.75%
Mortgage Type
Adjustable Rate Mortgage/ARM
Estimated Equity
$246,233
Purchase Details
Closed on
Feb 22, 2002
Sold by
Craft Homes Usa Llc
Bought by
Reynolds John D and Fedin Christie A
Home Financials for this Owner
Home Financials are based on the most recent Mortgage that was taken out on this home.
Original Mortgage
$149,935
Interest Rate
7.02%
Mortgage Type
FHA
Purchase Details
Closed on
Nov 1, 1996
Bought by
B W Homes Inc
Create a Home Valuation Report for This Property
The Home Valuation Report is an in-depth analysis detailing your home's value as well as a comparison with similar homes in the area
Home Values in the Area
Average Home Value in this Area
Purchase History
| Date | Buyer | Sale Price | Title Company |
|---|---|---|---|
| Bryant Patrick | $156,000 | None Available | |
| Reynolds John D | $152,500 | -- | |
| B W Homes Inc | -- | -- |
Source: Public Records
Mortgage History
| Date | Status | Borrower | Loan Amount |
|---|---|---|---|
| Open | Bryant Patrick | $132,600 | |
| Previous Owner | Reynolds John D | $149,935 |
Source: Public Records
Tax History Compared to Growth
Tax History
| Year | Tax Paid | Tax Assessment Tax Assessment Total Assessment is a certain percentage of the fair market value that is determined by local assessors to be the total taxable value of land and additions on the property. | Land | Improvement |
|---|---|---|---|---|
| 2025 | $3,338 | $335,150 | $80,000 | $255,150 |
| 2024 | $3,338 | $335,150 | $80,000 | $255,150 |
| 2023 | $2,365 | $193,830 | $41,000 | $152,830 |
| 2022 | $2,365 | $193,830 | $41,000 | $152,830 |
| 2021 | $2,365 | $193,830 | $41,000 | $152,830 |
| 2020 | $2,365 | $193,830 | $41,000 | $152,830 |
| 2019 | $1,900 | $155,750 | $25,000 | $130,750 |
| 2018 | $1,869 | $155,750 | $25,000 | $130,750 |
| 2017 | $1,838 | $155,750 | $25,000 | $130,750 |
| 2016 | $1,090 | $142,840 | $25,000 | $117,840 |
| 2015 | $1,686 | $142,840 | $25,000 | $117,840 |
| 2014 | $1,686 | $142,840 | $25,000 | $117,840 |
Source: Public Records
Map
Nearby Homes
- 4294 Kiser Woods Dr SW
- 4227 Kiser Woods Dr SW
- 1150 Hearth Ln SW
- 4531 Falls Lake Dr SW
- 5356 Zion Church Rd
- 123 Softwind Ln
- 910/820 Archibald Rd
- 137 Softwind Ln
- 1130 Brigadoon Ct
- 4194 Clifftonville Ave SW
- 1001 Loch Lomond Cir
- 5209 Moonlight Trail SW
- 2085 Chapel Creek Rd SW
- 518 Viking Place SW
- 4183 Broadstairs Dr
- 4285 Long Arrow Dr
- 4175 Broadstairs Dr
- 493 Debra Cir SW
- 1051 Manston Place SW
- 208 Falcon Dr
- 4293 Deacon Ct SW
- 4285 Deacon Ct SW
- 4290 Kiser Woods Dr SW
- 4281 Deacon Ct SW
- 4297 Deacon Ct SW
- 4286 Kiser Woods Dr SW
- 4298 Kiser Woods Dr SW
- 4284 Deacon Ct SW
- 4288 Deacon Ct SW
- 4280 Deacon Ct SW
- 4292 Deacon Ct SW
- 4277 Deacon Ct SW
- 4282 Kiser Woods Dr SW
- 4282 Kiser Woods Dr SW Unit 86
- 4302 Kiser Woods Dr SW
- 4276 Deacon Ct SW
- 4301 Deacon Ct SW
- 4296 Deacon Ct SW
- 4278 Kiser Woods Dr SW
- 4306 Kiser Woods Dr SW