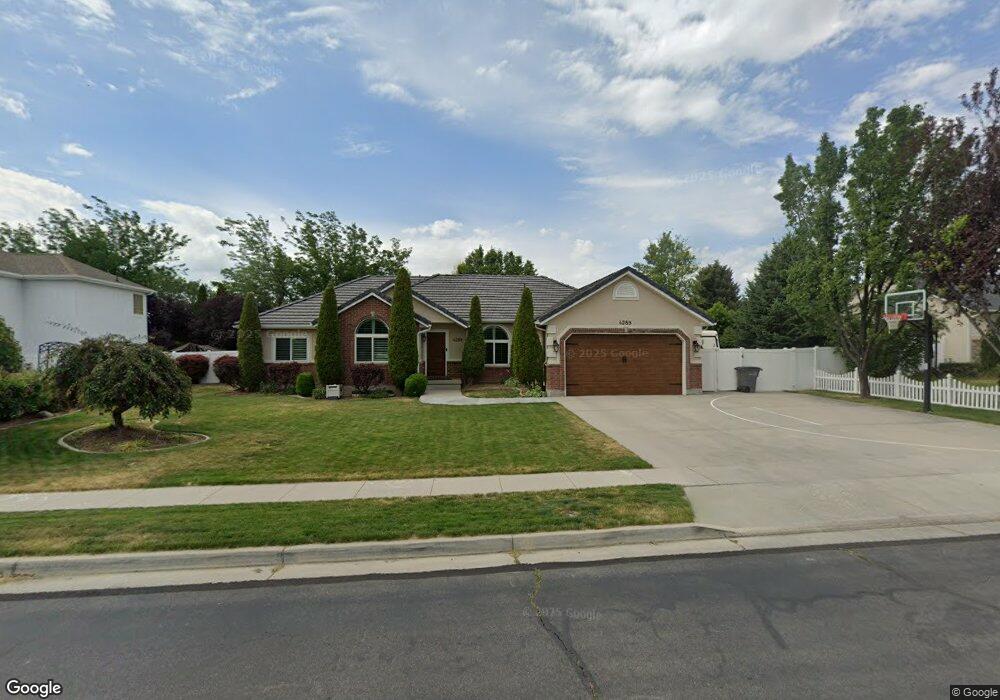
4289 Harvest Moon Dr South Jordan, UT 84095
Daybreak NeighborhoodEstimated Value: $700,189 - $727,000
5
Beds
4
Baths
1,778
Sq Ft
$402/Sq Ft
Est. Value
About This Home
This home is located at 4289 Harvest Moon Dr, South Jordan, UT 84095 and is currently estimated at $715,047, approximately $402 per square foot. 4289 Harvest Moon Dr is a home located in Salt Lake County with nearby schools including Daybreak Elementary School, Mountain Creek Middle School, and Herriman High School.
Ownership History
Date
Name
Owned For
Owner Type
Purchase Details
Closed on
Oct 29, 1999
Sold by
Rdm Construction Inc
Bought by
Andersen Kelton W and Andersen Annel H
Current Estimated Value
Home Financials for this Owner
Home Financials are based on the most recent Mortgage that was taken out on this home.
Original Mortgage
$115,560
Outstanding Balance
$35,091
Interest Rate
7.68%
Estimated Equity
$679,956
Purchase Details
Closed on
Jul 13, 1999
Sold by
Mathews Rob
Bought by
Rdm Construction Inc
Home Financials for this Owner
Home Financials are based on the most recent Mortgage that was taken out on this home.
Original Mortgage
$138,750
Interest Rate
7.64%
Purchase Details
Closed on
May 25, 1999
Sold by
Bg South Jordan Associates Ltd
Bought by
Mathews Rob
Home Financials for this Owner
Home Financials are based on the most recent Mortgage that was taken out on this home.
Original Mortgage
$138,750
Interest Rate
7.64%
Create a Home Valuation Report for This Property
The Home Valuation Report is an in-depth analysis detailing your home's value as well as a comparison with similar homes in the area
Home Values in the Area
Average Home Value in this Area
Purchase History
| Date | Buyer | Sale Price | Title Company |
|---|---|---|---|
| Andersen Kelton W | -- | Backman Stewart Title Servic | |
| Rdm Construction Inc | -- | Security Title Ins Agency | |
| Mathews Rob | -- | Legacy Land Title |
Source: Public Records
Mortgage History
| Date | Status | Borrower | Loan Amount |
|---|---|---|---|
| Open | Andersen Kelton W | $115,560 | |
| Previous Owner | Rdm Construction Inc | $138,750 |
Source: Public Records
Tax History Compared to Growth
Tax History
| Year | Tax Paid | Tax Assessment Tax Assessment Total Assessment is a certain percentage of the fair market value that is determined by local assessors to be the total taxable value of land and additions on the property. | Land | Improvement |
|---|---|---|---|---|
| 2025 | $3,332 | $652,400 | $211,700 | $440,700 |
| 2024 | $3,332 | $632,600 | $205,600 | $427,000 |
| 2023 | $3,387 | $606,700 | $197,700 | $409,000 |
| 2022 | $3,516 | $617,400 | $193,800 | $423,600 |
| 2021 | $183 | $472,500 | $134,600 | $337,900 |
| 2020 | $2,679 | $404,500 | $114,200 | $290,300 |
| 2019 | $2,702 | $401,000 | $114,200 | $286,800 |
| 2018 | $40 | $375,100 | $111,800 | $263,300 |
| 2017 | $2,424 | $350,900 | $111,800 | $239,100 |
| 2016 | $0 | $321,700 | $111,800 | $209,900 |
| 2015 | $2,154 | $296,400 | $113,900 | $182,500 |
| 2014 | -- | $279,400 | $108,600 | $170,800 |
Source: Public Records
Map
Nearby Homes
- 4347 W 11770 S
- 11777 S 4210 W
- 4463 W Harvest Sun Ln
- 4454 W 11800 S
- 4466 W 11800 S
- 4144 W Foxview Dr
- 11851 S Graycliff Rd
- 4536 W Silent Rain Dr
- 4555 W Open Hill Dr
- 12159 Swensen Cir
- 11347 S Kestrel Rise Rd
- 4491 W Daybreak Rim Way
- 11768 S Copper Sky Dr
- 11915 Goldsmith Ct
- 12667 S Lincoln Peak Ln Unit 132
- 12667 S Lincoln Peak Ln Unit 125
- 12667 S Lincoln Peak Ln
- 12671 S Lincoln Peak Ln Unit 131
- 12671 S Lincoln Peak Ln
- 12687 S Lincoln Peak Ln Unit 126
- 4289 W Harvest Moon Dr
- 4303 W Harvest Moon Dr
- 4303 Harvest Moon Dr
- 4273 W Harvest Moon Dr
- 4292 Country Crossing Ct
- 4292 W Country Crossing Ct Unit 356
- 4292 W Country Crossing Ct
- 4306 W Country Crossing Ct
- 4306 Country Crossing Ct
- 4276 W Country Crossing Ct
- 4276 Country Crossing Ct
- 4321 W Harvest Moon Dr
- 4321 Harvest Moon Dr
- 11702 Country Crossing Ct
- 4322 Country Crossing Ct
- 4297 Country Crossing Ct
- 11707 Country Crossing Rd
- 11707 S Country Crossing
- 11707 S Country Crossing Rd
- 11677 S 4340 W