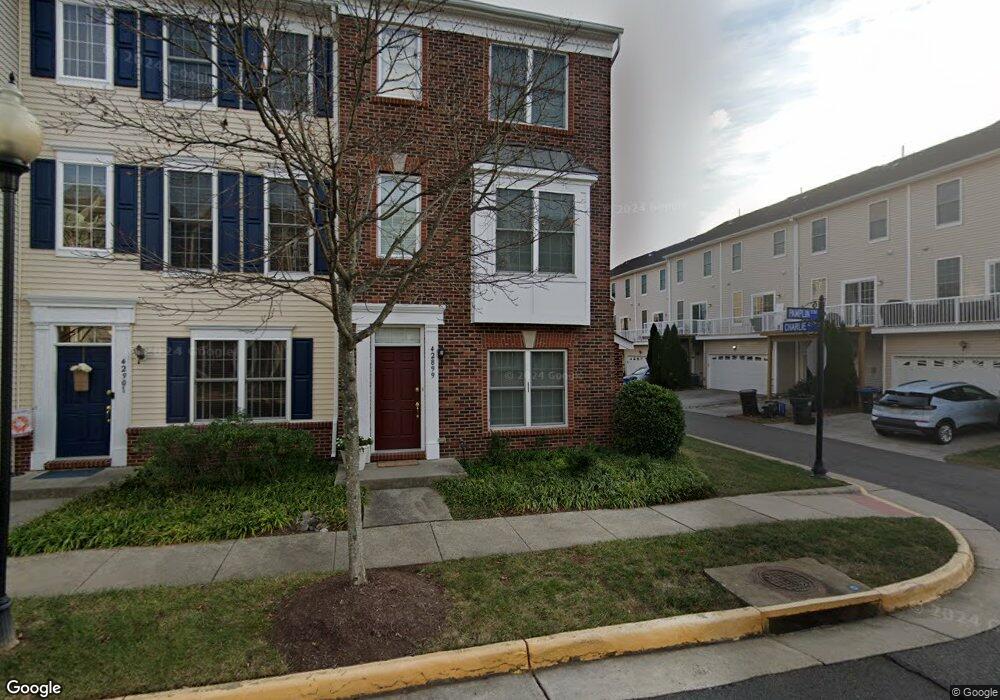
42899 Pamplin Terrace Unit 67A Chantilly, VA 20152
Estimated Value: $515,000 - $546,000
3
Beds
4
Baths
1,500
Sq Ft
$354/Sq Ft
Est. Value
About This Home
This home is located at 42899 Pamplin Terrace Unit 67A, Chantilly, VA 20152 and is currently estimated at $531,062, approximately $354 per square foot. 42899 Pamplin Terrace Unit 67A is a home located in Loudoun County with nearby schools including Liberty Elementary School, Mercer Middle School, and John Champe High School.
Ownership History
Date
Name
Owned For
Owner Type
Purchase Details
Closed on
Feb 24, 2025
Sold by
Paramount Investments Llc and Metro Relocation Services Llc
Bought by
Nguyen Trung Hieu Tran
Current Estimated Value
Purchase Details
Closed on
Jul 1, 2024
Sold by
Kmetz Elissa N and M Wilcox Law Pllc
Bought by
Metro Relocation Services Llc and Paramount Investments
Purchase Details
Closed on
Nov 28, 2011
Sold by
Lee Ellen
Bought by
Kmetz Elissa N
Home Financials for this Owner
Home Financials are based on the most recent Mortgage that was taken out on this home.
Original Mortgage
$292,395
Interest Rate
3.87%
Mortgage Type
FHA
Purchase Details
Closed on
May 15, 2008
Sold by
South Riding Partners Amb
Bought by
Lee Ellen
Home Financials for this Owner
Home Financials are based on the most recent Mortgage that was taken out on this home.
Original Mortgage
$310,500
Interest Rate
5.91%
Mortgage Type
New Conventional
Create a Home Valuation Report for This Property
The Home Valuation Report is an in-depth analysis detailing your home's value as well as a comparison with similar homes in the area
Home Values in the Area
Average Home Value in this Area
Purchase History
| Date | Buyer | Sale Price | Title Company |
|---|---|---|---|
| Nguyen Trung Hieu Tran | $535,000 | Fidelity National Title | |
| Metro Relocation Services Llc | $189,000 | None Listed On Document | |
| Kmetz Elissa N | $300,000 | -- | |
| Lee Ellen | $345,000 | -- |
Source: Public Records
Mortgage History
| Date | Status | Borrower | Loan Amount |
|---|---|---|---|
| Previous Owner | Kmetz Elissa N | $292,395 | |
| Previous Owner | Lee Ellen | $310,500 |
Source: Public Records
Tax History Compared to Growth
Tax History
| Year | Tax Paid | Tax Assessment Tax Assessment Total Assessment is a certain percentage of the fair market value that is determined by local assessors to be the total taxable value of land and additions on the property. | Land | Improvement |
|---|---|---|---|---|
| 2025 | $4,132 | $513,320 | $150,000 | $363,320 |
| 2024 | $4,187 | $484,060 | $140,000 | $344,060 |
| 2023 | $3,869 | $442,150 | $140,000 | $302,150 |
| 2022 | $3,747 | $421,010 | $125,000 | $296,010 |
| 2021 | $3,740 | $381,640 | $110,000 | $271,640 |
| 2020 | $3,791 | $366,240 | $110,000 | $256,240 |
| 2019 | $3,626 | $346,990 | $110,000 | $236,990 |
| 2018 | $3,578 | $329,760 | $110,000 | $219,760 |
| 2017 | $3,553 | $315,820 | $110,000 | $205,820 |
| 2016 | $3,545 | $309,650 | $0 | $0 |
| 2015 | $3,584 | $205,760 | $0 | $205,760 |
| 2014 | $3,605 | $202,120 | $0 | $202,120 |
Source: Public Records
Map
Nearby Homes
- 42828 Nations St
- 25167 Femoyer Terrace
- 25192 Whippoorwill Terrace
- 25304 Whippoorwill Terrace
- 25304 Shipley Terrace
- 25328 Ashbury Dr
- 42667 Homefront Terrace
- 43140 Town Hall Plaza
- 42790 Sykes Terrace
- 42799 Sykes Terrace
- 42634 Lancaster Ridge Terrace
- 25280 Lake Shore Square Unit 205
- 0 Nethers Rd Unit VARP2001570
- 25390 Shipley Terrace
- 42791 Flannigan Terrace
- 25065 Riding Center Dr
- 42893 Golf View Dr
- 42768 Kearney Terrace
- 43134 Watercrest Square Unit 200
- 42769 Atchison Terrace
- 42901 Pamplin Terrace
- 42901 Pamplin Terrace
- 42901 Pamplin Terrace Unit 67B
- 42903 Pamplin Terrace
- 42899 Pamplin Terrace
- 42905 Pamplin Terrace Unit 67D
- 42905 Pamplin Terrace
- 42907 Pamplin Terrace
- 42907 Pamplin Terrace Unit 67E
- 42909 Pamplin Terrace Unit 67F
- 42909 Pamplin Terrace
- 42911 Pamplin Terrace Unit 67G
- 42911 Pamplin Terrace
- 42908 Mccomas Terrace Unit 66F
- 42908 Mccomas Terrace
- 42910 Mccomas Terrace
- 42910 Mccomas Terrace Unit 66B
- 42912 Mccomas Terrace
- 42912 Mccomas Terrace Unit 66C
- 25116 Monteith Terrace