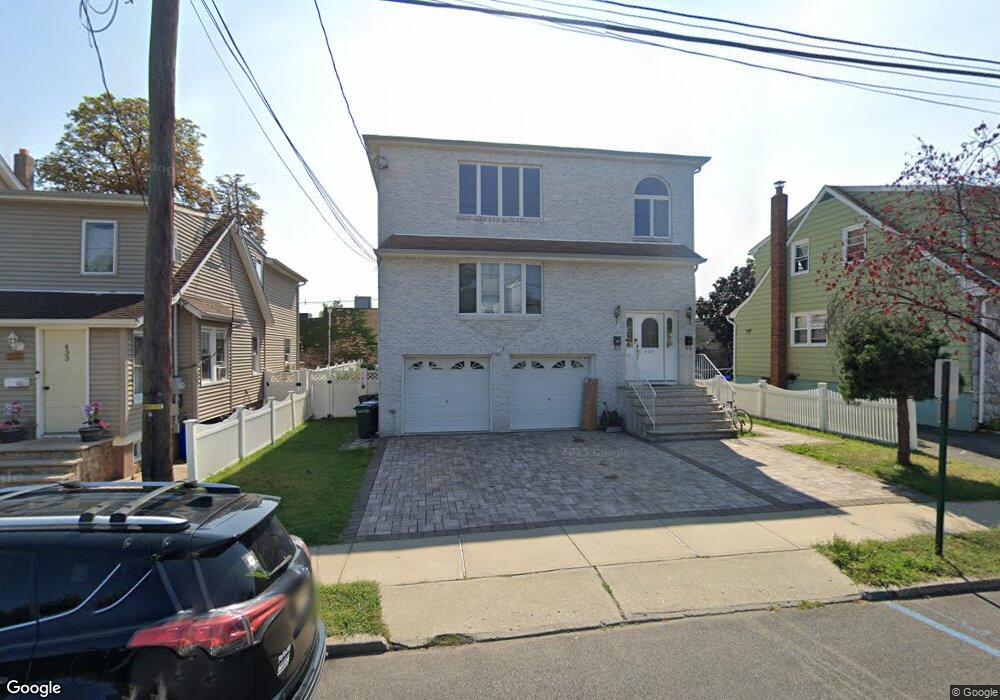
429 10th St Carlstadt, NJ 07072
Estimated Value: $990,000 - $1,105,000
3
Beds
3
Baths
3,000
Sq Ft
$343/Sq Ft
Est. Value
About This Home
This home is located at 429 10th St, Carlstadt, NJ 07072 and is currently estimated at $1,028,354, approximately $342 per square foot. 429 10th St is a home located in Bergen County with nearby schools including Carlstadt Public School, Henry P Becton Regional High School, and Montessori School of East Rutherford.
Ownership History
Date
Name
Owned For
Owner Type
Purchase Details
Closed on
Jul 21, 2006
Sold by
429 10Th Land Trust
Bought by
Hoti Alo and Hoti Nafija
Current Estimated Value
Home Financials for this Owner
Home Financials are based on the most recent Mortgage that was taken out on this home.
Original Mortgage
$500,000
Outstanding Balance
$297,166
Interest Rate
6.67%
Estimated Equity
$731,188
Purchase Details
Closed on
Aug 23, 2003
Sold by
Anthony Pizza
Bought by
Lee Mi Hwa
Home Financials for this Owner
Home Financials are based on the most recent Mortgage that was taken out on this home.
Original Mortgage
$454,000
Interest Rate
5.69%
Create a Home Valuation Report for This Property
The Home Valuation Report is an in-depth analysis detailing your home's value as well as a comparison with similar homes in the area
Home Values in the Area
Average Home Value in this Area
Purchase History
| Date | Buyer | Sale Price | Title Company |
|---|---|---|---|
| Hoti Alo | $691,200 | -- | |
| 429 10Th Land Trust | -- | -- | |
| Lee Mi Hwa | $505,000 | -- |
Source: Public Records
Mortgage History
| Date | Status | Borrower | Loan Amount |
|---|---|---|---|
| Open | 429 10Th Land Trust | $500,000 | |
| Previous Owner | Lee Mi Hwa | $454,000 |
Source: Public Records
Tax History Compared to Growth
Tax History
| Year | Tax Paid | Tax Assessment Tax Assessment Total Assessment is a certain percentage of the fair market value that is determined by local assessors to be the total taxable value of land and additions on the property. | Land | Improvement |
|---|---|---|---|---|
| 2025 | $14,889 | $927,800 | $235,100 | $692,700 |
| 2024 | $13,997 | $896,400 | $223,300 | $673,100 |
| 2023 | $13,193 | $850,900 | $197,100 | $653,800 |
| 2022 | $13,193 | $781,600 | $180,500 | $601,100 |
| 2021 | $13,498 | $744,500 | $168,600 | $575,900 |
| 2020 | $12,127 | $683,200 | $163,900 | $519,300 |
| 2019 | $11,883 | $647,600 | $161,500 | $486,100 |
| 2018 | $12,303 | $640,100 | $159,100 | $481,000 |
| 2017 | $11,993 | $629,200 | $156,800 | $472,400 |
| 2016 | $11,274 | $530,300 | $150,000 | $380,300 |
| 2015 | $10,977 | $530,300 | $150,000 | $380,300 |
| 2014 | $10,558 | $530,300 | $150,000 | $380,300 |
Source: Public Records
Map
Nearby Homes
- 344 10th St
- 426 Broad St
- 340 Marsan Dr
- 38 Hackensack St
- 78 Columbia St
- 30 Humboldt St
- 88 Columbia St
- 53 Hackensack St
- 327 Madison St
- 409 Washington St
- 573 Anderson Ave
- 89 Rose St
- 167 Columbia St
- 165 Madison St
- 593 Broad St
- 58 Mozart St
- 560 Ryerson Ave
- 245 Cliff St
- 132 Union Ave Unit 405A
- 364 Wood Ridge Ave