Estimated Value: $244,988 - $273,000
3
Beds
1
Bath
1,237
Sq Ft
$210/Sq Ft
Est. Value
About This Home
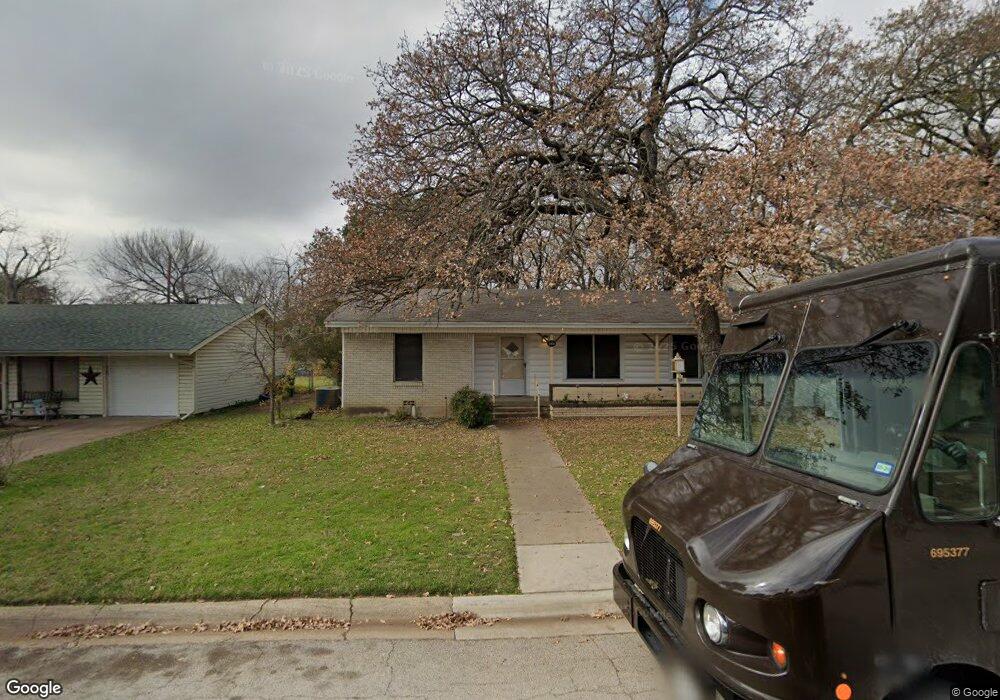
This home is located at 429 Anderson Dr, Hurst, TX 76053 and is currently estimated at $259,497, approximately $209 per square foot. 429 Anderson Dr is a home located in Tarrant County with nearby schools including West Hurst Elementary School, Hurst J High School, and L.D. Bell High School.
Ownership History
Date
Name
Owned For
Owner Type
Purchase Details
Closed on
Apr 25, 2018
Sold by
Hollman Michael L
Bought by
Hollman Holdings L L C
Current Estimated Value
Purchase Details
Closed on
Aug 26, 2002
Sold by
Hesidence James Paul
Bought by
Hollman Michael L
Home Financials for this Owner
Home Financials are based on the most recent Mortgage that was taken out on this home.
Original Mortgage
$73,600
Outstanding Balance
$31,261
Interest Rate
6.47%
Estimated Equity
$228,236
Purchase Details
Closed on
Sep 23, 1997
Sold by
Kinkade Doris and Kinkade A
Bought by
Hesidence James Paul
Home Financials for this Owner
Home Financials are based on the most recent Mortgage that was taken out on this home.
Original Mortgage
$53,016
Interest Rate
7.56%
Mortgage Type
FHA
Create a Home Valuation Report for This Property
The Home Valuation Report is an in-depth analysis detailing your home's value as well as a comparison with similar homes in the area
Home Values in the Area
Average Home Value in this Area
Purchase History
| Date | Buyer | Sale Price | Title Company |
|---|---|---|---|
| Hollman Holdings L L C | -- | None Available | |
| Hollman Michael L | -- | American Title Co | |
| Hesidence James Paul | -- | American Title Company |
Source: Public Records
Mortgage History
| Date | Status | Borrower | Loan Amount |
|---|---|---|---|
| Open | Hollman Michael L | $73,600 | |
| Previous Owner | Hesidence James Paul | $53,016 |
Source: Public Records
Tax History Compared to Growth
Tax History
| Year | Tax Paid | Tax Assessment Tax Assessment Total Assessment is a certain percentage of the fair market value that is determined by local assessors to be the total taxable value of land and additions on the property. | Land | Improvement |
|---|---|---|---|---|
| 2025 | $4,904 | $240,078 | $60,000 | $180,078 |
| 2024 | $4,904 | $240,078 | $60,000 | $180,078 |
| 2023 | $4,785 | $238,862 | $30,000 | $208,862 |
| 2022 | $4,595 | $199,585 | $30,000 | $169,585 |
| 2021 | $4,329 | $179,500 | $30,000 | $149,500 |
| 2020 | $3,534 | $146,896 | $30,000 | $116,896 |
| 2019 | $3,555 | $145,269 | $30,000 | $115,269 |
| 2018 | $3,199 | $130,691 | $18,000 | $112,691 |
| 2017 | $3,149 | $124,436 | $18,000 | $106,436 |
| 2016 | $2,801 | $110,681 | $18,000 | $92,681 |
| 2015 | $1,862 | $71,000 | $12,000 | $59,000 |
| 2014 | $1,862 | $71,000 | $12,000 | $59,000 |
Source: Public Records
Map
Nearby Homes
- 741 Ponderosa Dr
- 408 Simmons Dr
- 425 Ridgecrest Dr
- 758 Briarwood Ln
- 756 Briarwood Ln
- 744 Briarwood Ln
- 637 Post Oak Dr
- 425 Moore Creek Rd
- 808 Betty Ct
- 520 W Redbud Dr
- 628 Elm St
- 612 Elm St
- 708 Hurstview Dr
- 516 Hurstview Dr
- 405 Billy Creek Cir
- 125 Souder Dr
- 616 Timberline Dr
- 649 Timberline Dr
- 231 Elm St
- 632 Forest Ln
- 425 Anderson Dr
- 737 W Redbud Dr
- 428 Anderson Dr
- 421 Anderson Dr
- 732 W Redbud Dr
- 741 W Redbud Dr
- 736 W Redbud Dr
- 736 Ruth Ln
- 424 Anderson Dr
- 740 W Redbud Dr
- 724 W Redbud Dr
- 740 Ruth Ln
- 745 W Redbud Dr
- 721 W Redbud Dr
- 420 Anderson Dr
- 744 W Redbud Dr
- 720 W Redbud Dr
- 744 Ruth Ln
- 416 Anderson Dr
- 409 Anderson Dr