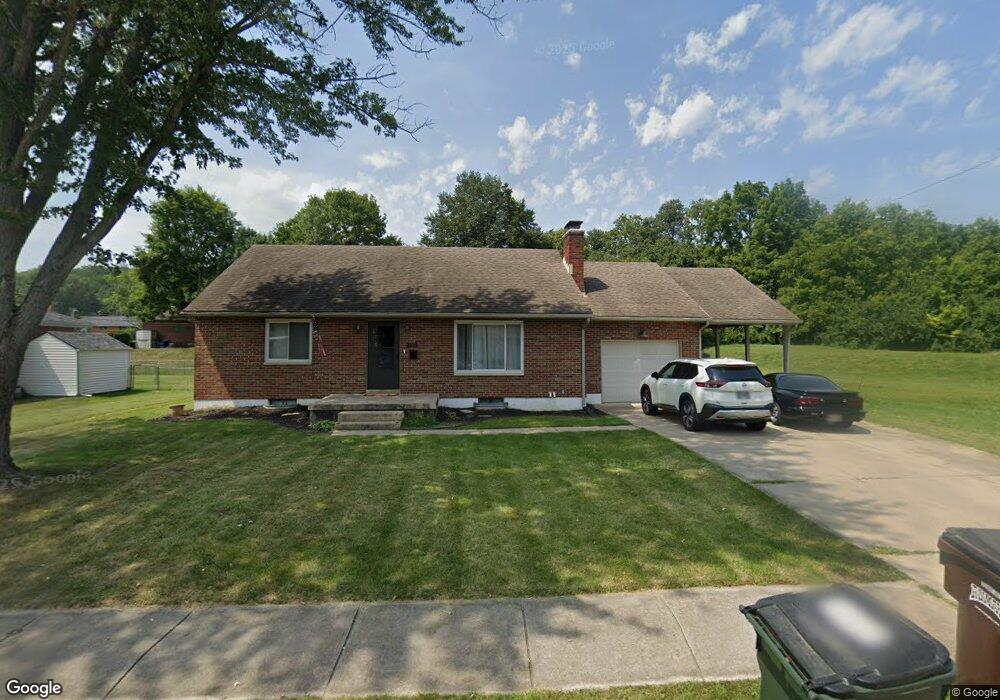
429 Dee Ave Miamisburg, OH 45342
Estimated Value: $158,695 - $208,000
3
Beds
1
Bath
1,036
Sq Ft
$169/Sq Ft
Est. Value
About This Home
This home is located at 429 Dee Ave, Miamisburg, OH 45342 and is currently estimated at $175,174, approximately $169 per square foot. 429 Dee Ave is a home located in Montgomery County with nearby schools including Miamisburg High School and Bethel Baptist School.
Ownership History
Date
Name
Owned For
Owner Type
Purchase Details
Closed on
Feb 17, 2011
Sold by
Barnes Barry P and Barnes Lois F
Bought by
Nestor Lisa J
Current Estimated Value
Home Financials for this Owner
Home Financials are based on the most recent Mortgage that was taken out on this home.
Original Mortgage
$96,490
Outstanding Balance
$65,932
Interest Rate
4.75%
Mortgage Type
FHA
Estimated Equity
$109,242
Purchase Details
Closed on
Apr 23, 2010
Sold by
The Secretary Of Veterans Affairs
Bought by
Barnes Barry P and Barnes Lois F
Purchase Details
Closed on
Nov 24, 2009
Sold by
Schechter David A
Bought by
Secretary Of Veterans Affairs
Purchase Details
Closed on
Aug 17, 2004
Sold by
Bullock Marc N and Bullock Melissa A
Bought by
Schechter David A and Schechter Kyrsten R
Home Financials for this Owner
Home Financials are based on the most recent Mortgage that was taken out on this home.
Original Mortgage
$122,640
Interest Rate
6.1%
Mortgage Type
VA
Create a Home Valuation Report for This Property
The Home Valuation Report is an in-depth analysis detailing your home's value as well as a comparison with similar homes in the area
Home Values in the Area
Average Home Value in this Area
Purchase History
| Date | Buyer | Sale Price | Title Company |
|---|---|---|---|
| Nestor Lisa J | $99,000 | Attorney | |
| Barnes Barry P | $66,405 | Attorney | |
| Secretary Of Veterans Affairs | $56,000 | None Available | |
| Schechter David A | $120,000 | -- |
Source: Public Records
Mortgage History
| Date | Status | Borrower | Loan Amount |
|---|---|---|---|
| Open | Nestor Lisa J | $96,490 | |
| Previous Owner | Schechter David A | $122,640 |
Source: Public Records
Tax History Compared to Growth
Tax History
| Year | Tax Paid | Tax Assessment Tax Assessment Total Assessment is a certain percentage of the fair market value that is determined by local assessors to be the total taxable value of land and additions on the property. | Land | Improvement |
|---|---|---|---|---|
| 2024 | $2,492 | $38,800 | $7,440 | $31,360 |
| 2023 | $2,492 | $38,800 | $7,440 | $31,360 |
| 2022 | $2,330 | $30,550 | $5,860 | $24,690 |
| 2021 | $2,065 | $30,550 | $5,860 | $24,690 |
| 2020 | $2,061 | $30,550 | $5,860 | $24,690 |
| 2019 | $2,102 | $28,620 | $5,330 | $23,290 |
| 2018 | $2,109 | $28,620 | $5,330 | $23,290 |
| 2017 | $2,095 | $28,620 | $5,330 | $23,290 |
| 2016 | $2,082 | $27,420 | $5,330 | $22,090 |
| 2015 | $2,042 | $27,420 | $5,330 | $22,090 |
| 2014 | $2,042 | $27,420 | $5,330 | $22,090 |
| 2012 | -- | $33,050 | $7,610 | $25,440 |
Source: Public Records
Map
Nearby Homes